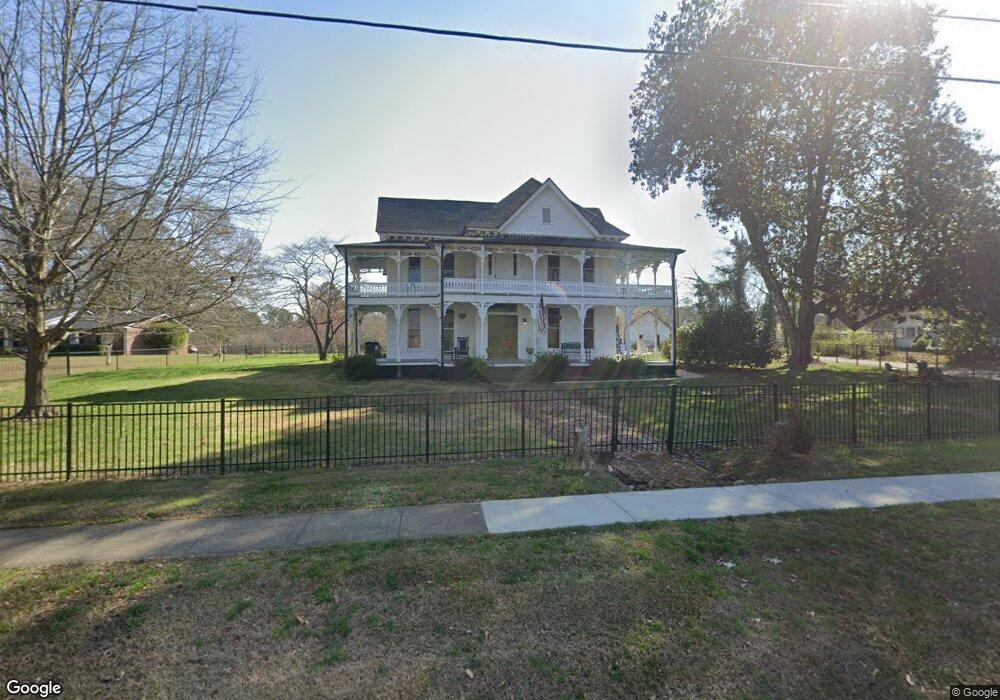
371 Bowdon St Tallapoosa, GA 30176
Estimated Value: $227,275 - $318,000
2
Beds
3
Baths
3,678
Sq Ft
$75/Sq Ft
Est. Value
About This Home
This home is located at 371 Bowdon St, Tallapoosa, GA 30176 and is currently estimated at $275,069, approximately $74 per square foot. 371 Bowdon St is a home located in Haralson County with nearby schools including Haralson County High School.
Ownership History
Date
Name
Owned For
Owner Type
Purchase Details
Closed on
Oct 12, 2022
Sold by
Miller Moats Melinda
Bought by
Moats Timothy J and Miller Moats Melinda
Current Estimated Value
Home Financials for this Owner
Home Financials are based on the most recent Mortgage that was taken out on this home.
Original Mortgage
$210,000
Outstanding Balance
$202,054
Interest Rate
6.02%
Mortgage Type
New Conventional
Estimated Equity
$73,015
Purchase Details
Closed on
Mar 4, 2021
Sold by
Hulsey James Edward
Bought by
Moats Melinda Miller and Moats Timothy James
Home Financials for this Owner
Home Financials are based on the most recent Mortgage that was taken out on this home.
Original Mortgage
$151,900
Interest Rate
2.7%
Mortgage Type
New Conventional
Purchase Details
Closed on
Aug 14, 1995
Sold by
Sheffield Margaret Life Estate
Bought by
Hulsey Martha Marie and James Edward
Purchase Details
Closed on
Mar 31, 1992
Bought by
Sheffield Margaret E
Create a Home Valuation Report for This Property
The Home Valuation Report is an in-depth analysis detailing your home's value as well as a comparison with similar homes in the area
Home Values in the Area
Average Home Value in this Area
Purchase History
| Date | Buyer | Sale Price | Title Company |
|---|---|---|---|
| Moats Timothy J | -- | -- | |
| Moats Melinda Miller | $159,900 | -- | |
| Hulsey Martha Marie | -- | -- | |
| Sheffield Margaret E | -- | -- |
Source: Public Records
Mortgage History
| Date | Status | Borrower | Loan Amount |
|---|---|---|---|
| Open | Moats Timothy J | $210,000 | |
| Previous Owner | Moats Melinda Miller | $151,900 |
Source: Public Records
Tax History Compared to Growth
Tax History
| Year | Tax Paid | Tax Assessment Tax Assessment Total Assessment is a certain percentage of the fair market value that is determined by local assessors to be the total taxable value of land and additions on the property. | Land | Improvement |
|---|---|---|---|---|
| 2024 | $1,541 | $50,509 | $7,632 | $42,877 |
| 2023 | $1,790 | $56,298 | $7,000 | $49,298 |
| 2022 | $1,151 | $46,590 | $7,000 | $39,590 |
| 2021 | $1,196 | $44,364 | $7,000 | $37,364 |
| 2020 | $1,178 | $45,558 | $7,000 | $38,558 |
| 2019 | $1,217 | $45,366 | $7,000 | $38,366 |
| 2018 | $1,267 | $46,636 | $7,000 | $39,636 |
| 2017 | $1,796 | $43,884 | $7,000 | $36,884 |
| 2016 | $1,632 | $58,009 | $7,000 | $51,009 |
| 2015 | $1,601 | $56,642 | $7,000 | $49,642 |
| 2014 | $1,667 | $57,242 | $7,600 | $49,642 |
Source: Public Records
Map
Nearby Homes
- 438 Bowdon St
- 0 Georgia 120 Unit 7646686
- 0 Georgia 120 Unit 10600882
- 0 Broad St Unit 10614514
- 0 Broad St Unit 10614479
- 250 Kiker St
- 270 Head Ave
- 244 Monroe St
- 281 Alewine Ave
- 0 W Mill St Unit 10604030
- 0 W Mill St Unit 7649366
- 622 Cedartown Ave
- 117 White St
- 2633 Georgia 120 (485 53 Acres)
- 164 Berlin St
- 4493 Stone Mountain St
- 267 Williams St
- 711 Kay St
- 174 Faye St
- 194 Faye St
- 391 Bowdon St
- 351 Bowdon St
- 370 Bowdon St
- 341 Bowdon St
- 341 Bowdon St Unit .87 acre
- 356 Bowdon St
- 370 Robertson Ave
- 358 Robertson Ave
- 404 Bowdon St
- 409 Bowdon St
- 390 Robertson Ave
- 133 Chestnut St
- 330 Bowdon St
- 141 Chestnut St
- 148 Windom St
- 379 Robertson Ave
- 338 Robertson Ave
- 338 Robertson Ave
- 369 Robertson Ave
- 416 Robertson Ave