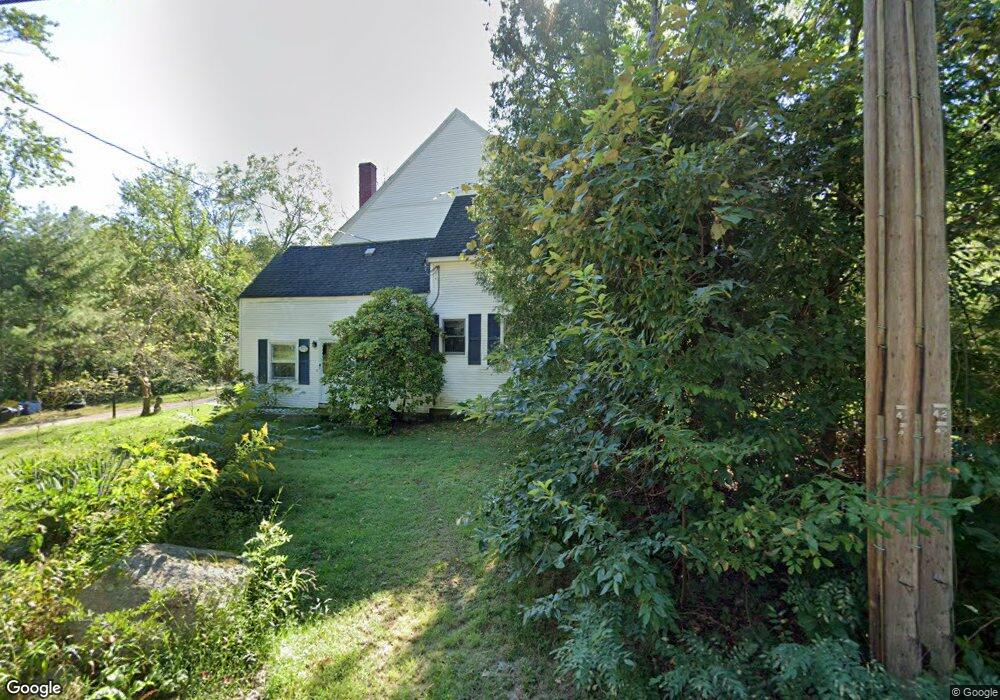
371 Chestnut St Wrentham, MA 02093
Sheldonville NeighborhoodEstimated Value: $622,000 - $686,000
3
Beds
3
Baths
1,855
Sq Ft
$354/Sq Ft
Est. Value
About This Home
This home is located at 371 Chestnut St, Wrentham, MA 02093 and is currently estimated at $657,208, approximately $354 per square foot. 371 Chestnut St is a home located in Norfolk County with nearby schools including Delaney Elementary School and Charles E Roderick.
Ownership History
Date
Name
Owned For
Owner Type
Purchase Details
Closed on
Apr 29, 1988
Sold by
Kamphenkel Fred P
Bought by
Stalley Graham C
Current Estimated Value
Home Financials for this Owner
Home Financials are based on the most recent Mortgage that was taken out on this home.
Original Mortgage
$151,200
Interest Rate
9.86%
Mortgage Type
Purchase Money Mortgage
Create a Home Valuation Report for This Property
The Home Valuation Report is an in-depth analysis detailing your home's value as well as a comparison with similar homes in the area
Home Values in the Area
Average Home Value in this Area
Purchase History
| Date | Buyer | Sale Price | Title Company |
|---|---|---|---|
| Stalley Graham C | $168,000 | -- |
Source: Public Records
Mortgage History
| Date | Status | Borrower | Loan Amount |
|---|---|---|---|
| Open | Stalley Graham C | $165,000 | |
| Closed | Stalley Graham C | $25,000 | |
| Closed | Stalley Graham C | $145,000 | |
| Closed | Stalley Graham C | $151,200 |
Source: Public Records
Tax History
| Year | Tax Paid | Tax Assessment Tax Assessment Total Assessment is a certain percentage of the fair market value that is determined by local assessors to be the total taxable value of land and additions on the property. | Land | Improvement |
|---|---|---|---|---|
| 2025 | $6,641 | $573,000 | $322,600 | $250,400 |
| 2024 | $6,449 | $537,400 | $322,600 | $214,800 |
| 2023 | $6,354 | $503,500 | $293,400 | $210,100 |
| 2022 | $5,577 | $408,000 | $233,700 | $174,300 |
| 2021 | $5,204 | $369,900 | $198,000 | $171,900 |
| 2020 | $4,801 | $336,900 | $163,900 | $173,000 |
| 2019 | $4,942 | $350,000 | $182,100 | $167,900 |
| 2018 | $4,874 | $342,300 | $181,900 | $160,400 |
| 2017 | $4,601 | $322,900 | $178,400 | $144,500 |
| 2016 | $4,434 | $310,500 | $173,300 | $137,200 |
| 2015 | $4,307 | $287,500 | $166,600 | $120,900 |
| 2014 | $4,239 | $276,900 | $160,200 | $116,700 |
Source: Public Records
Map
Nearby Homes
- 440 Chestnut St
- 955 Summer St
- 613 West St
- 0 Fall Ln
- 20 Field Cir
- 732 King St
- Lot 1 - Blueberry 2 Car Plan at King Philip Estates
- Lot 8 - Blueberry 2 Car Plan at King Philip Estates
- Lot 5 - Hughes 2 car Plan at King Philip Estates
- Lot 6 - Blueberry 3 Car Plan at King Philip Estates
- 10 Earle Stewart Ln Unit Lot 5
- Lot 2 - Camden 2 Car Plan at King Philip Estates
- Lot 7 - Cedar Plan at King Philip Estates
- Lot 4 - Hemingway 2 Car Plan at King Philip Estates
- 14 Earle Stewart Ln
- Lot 3 - Blueberry 2 Car Plan at King Philip Estates
- 1222 South St
- 12 Earle Stewart Ln
- 11 Amber Dr
- 19 Chestnut Lot 0
- 359 Chestnut St
- 352 Chestnut St
- 381 Chestnut St
- 356 Chestnut St
- 348 Chestnut St
- 391 Chestnut St
- 358 Chestnut St
- 346 Chestnut St
- 349 Chestnut St
- 5 Ingrid Dr
- 360 Chestnut St
- 405 Chestnut St
- 15 Ingrid Dr
- 287 Chestnut St
- 2 Ingrid Dr
- 20 Ingrid Dr
- 380 Chestnut St
- 308 Chestnut St
- 25 Whip Poor Will Cir
- 415 Chestnut St
Your Personal Tour Guide
Ask me questions while you tour the home.