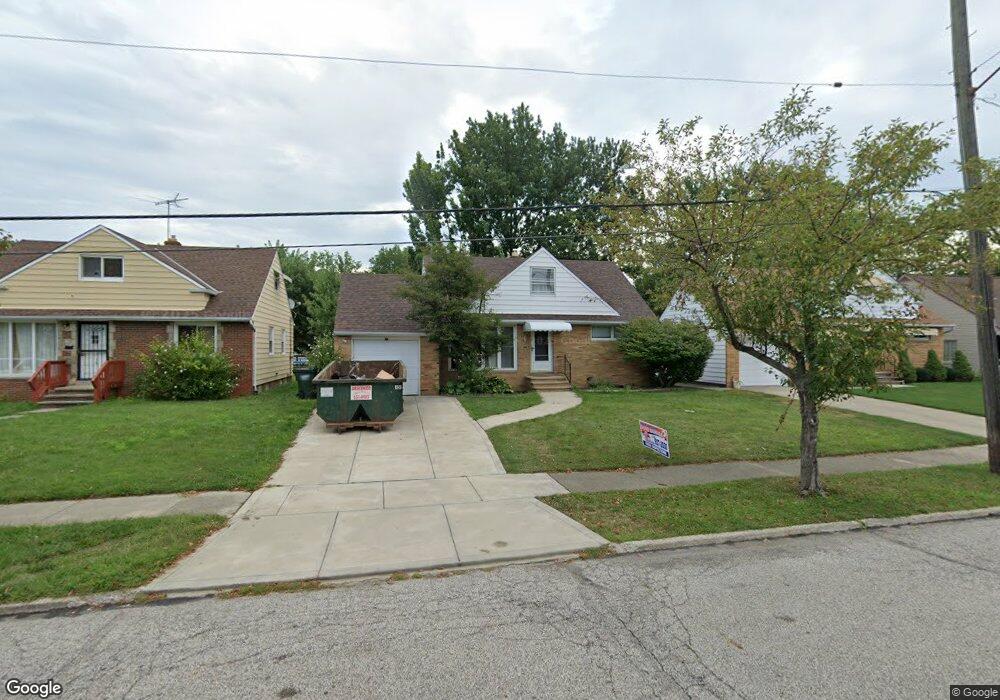
371 E 262nd St Euclid, OH 44132
Estimated Value: $134,294 - $200,000
3
Beds
1
Bath
1,215
Sq Ft
$132/Sq Ft
Est. Value
About This Home
This home is located at 371 E 262nd St, Euclid, OH 44132 and is currently estimated at $160,324, approximately $131 per square foot. 371 E 262nd St is a home located in Cuyahoga County with nearby schools including Shoreview Elementary School, Euclid High School, and Ss. Robert & William Catholic School.
Ownership History
Date
Name
Owned For
Owner Type
Purchase Details
Closed on
Nov 8, 2019
Sold by
Plovock Joseph R and Plovock Mary Ann
Bought by
Plovock Joseph R and Plovock Mary Ann
Current Estimated Value
Purchase Details
Closed on
Sep 14, 2006
Sold by
Helbling James H and Cherry Deborah A
Bought by
Plovock Joseph R
Home Financials for this Owner
Home Financials are based on the most recent Mortgage that was taken out on this home.
Original Mortgage
$99,200
Outstanding Balance
$62,219
Interest Rate
7.5%
Mortgage Type
Purchase Money Mortgage
Estimated Equity
$98,105
Purchase Details
Closed on
Oct 30, 1997
Sold by
Est John Bozich
Bought by
Helbling James H
Home Financials for this Owner
Home Financials are based on the most recent Mortgage that was taken out on this home.
Original Mortgage
$58,450
Interest Rate
7.51%
Mortgage Type
New Conventional
Purchase Details
Closed on
Jan 1, 1975
Bought by
Bozich John
Create a Home Valuation Report for This Property
The Home Valuation Report is an in-depth analysis detailing your home's value as well as a comparison with similar homes in the area
Home Values in the Area
Average Home Value in this Area
Purchase History
| Date | Buyer | Sale Price | Title Company |
|---|---|---|---|
| Plovock Joseph R | -- | None Available | |
| Plovock Joseph R | $124,000 | Hometownusa Title Agen | |
| Helbling James H | $83,500 | -- | |
| Bozich John | -- | -- |
Source: Public Records
Mortgage History
| Date | Status | Borrower | Loan Amount |
|---|---|---|---|
| Open | Plovock Joseph R | $99,200 | |
| Previous Owner | Helbling James H | $58,450 |
Source: Public Records
Tax History Compared to Growth
Tax History
| Year | Tax Paid | Tax Assessment Tax Assessment Total Assessment is a certain percentage of the fair market value that is determined by local assessors to be the total taxable value of land and additions on the property. | Land | Improvement |
|---|---|---|---|---|
| 2024 | $3,206 | $45,710 | $8,890 | $36,820 |
| 2023 | $2,980 | $33,850 | $6,760 | $27,090 |
| 2022 | $2,913 | $33,850 | $6,760 | $27,090 |
| 2021 | $3,249 | $33,850 | $6,760 | $27,090 |
| 2020 | $3,080 | $29,160 | $5,810 | $23,350 |
| 2019 | $3,078 | $83,300 | $16,600 | $66,700 |
| 2018 | $2,803 | $29,160 | $5,810 | $23,350 |
| 2017 | $3,019 | $26,250 | $4,830 | $21,420 |
| 2016 | $3,026 | $26,250 | $4,830 | $21,420 |
| 2015 | $2,758 | $26,250 | $4,830 | $21,420 |
| 2014 | $2,758 | $26,250 | $4,830 | $21,420 |
Source: Public Records
Map
Nearby Homes
- 355 E 262nd St
- 405 E 262nd St
- 325 E 257th St
- 415 E 266th St
- 26230 Oriole Ave
- 327 E 255th St
- 369 E 270th St
- 440 E 271st St
- 26171 Shoreview Ave
- 26471 Shoreview Ave
- 25380 Lakeshore Blvd
- 461 E 271st St
- 25801 Lake Shore Blvd Unit 23
- 25801 Lake Shore Blvd Unit 64
- 25801 Lake Shore Blvd Unit 130
- 25801 Lake Shore Blvd Unit 28
- 25650 Shoreview Ave
- 251 E 250th St
- 253 E 250th St
- 26351 Farringdon Ave