
Landlord's Agent in 2025
Gwen Michon
Century 21 Investment Realty
(985) 502-5952
90 in this area
123 Total Sales
Estimated Value: $168,799 - $219,000
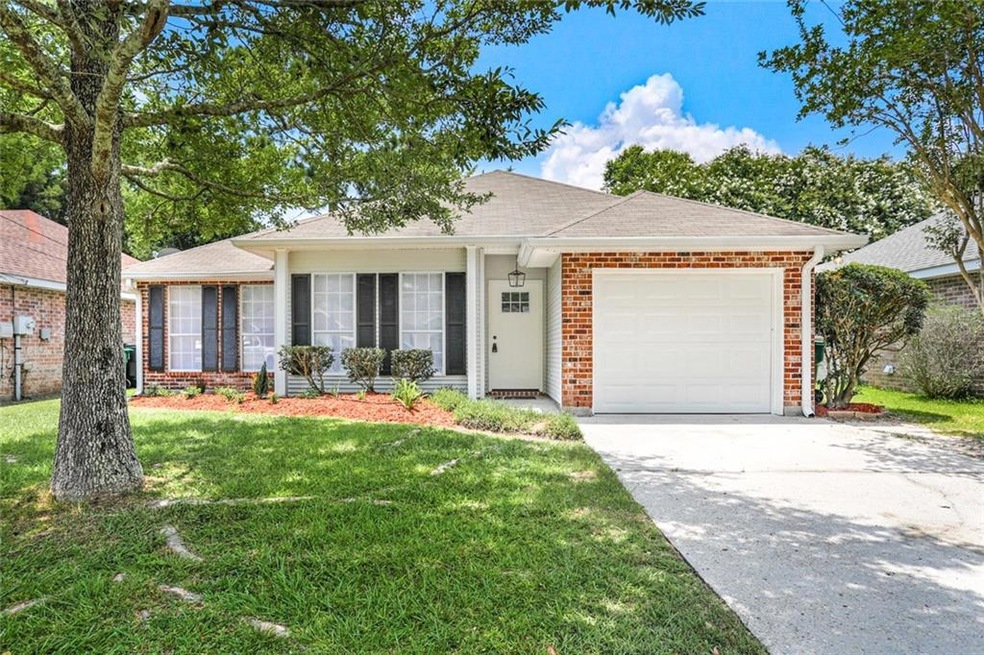
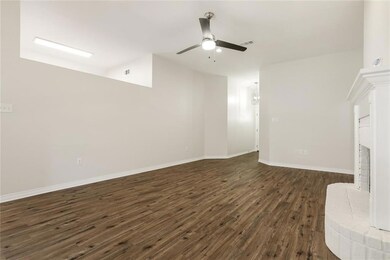
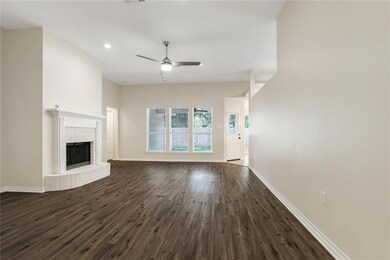
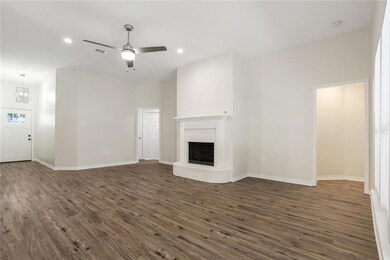
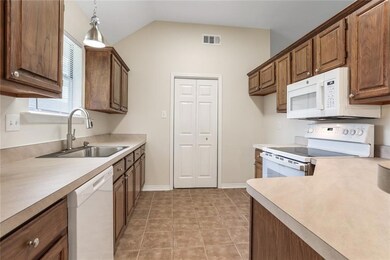
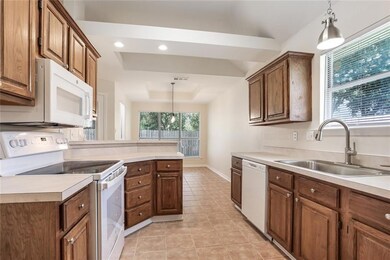
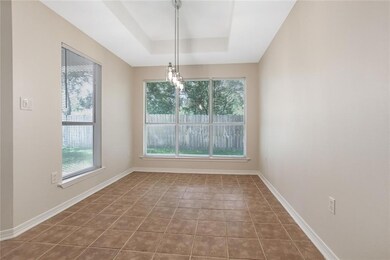
MOVE-IN READY *NEWLY RENOVATED *NEW A/C *FLOORING *FRESH PAINT *NEW APPLIANCES, INCLUDING NEW REFRIGERATOR *NEW SINK *NEW GARBAGE DISPOSAL *NEW BATH VANITY *NEW TUB *NEW DOORS *NEW GARAGE DOOR *NEW CEILING FANS *NEW TOILETS *NEW LIGHT FIXTURES *NEW BLINDS *WOOD BURNING FIREPLACE *FRESH LANDSCAPING *FENCED YARD
Last Agent to Rent the Property
Century 21 Investment Realty License #000072144 Listed on: 01/29/2025
Last Renter's Agent
Century 21 Investment Realty License #000072144 Listed on: 01/29/2025
| Date | Event | Price | List to Sale | Price per Sq Ft |
|---|---|---|---|---|
| 03/14/2025 03/14/25 | Rented | $1,800 | 0.0% | -- |
| 02/17/2025 02/17/25 | Under Contract | -- | -- | -- |
| 01/29/2025 01/29/25 | For Rent | $1,800 | 0.0% | -- |
| 06/13/2022 06/13/22 | For Rent | $1,800 | 0.0% | -- |
| 06/13/2022 06/13/22 | Rented | $1,800 | +44.0% | -- |
| 03/16/2015 03/16/15 | Rented | $1,250 | -3.8% | -- |
| 03/16/2015 03/16/15 | For Rent | $1,300 | 0.0% | -- |
| 05/20/2014 05/20/14 | For Rent | $1,300 | +1.6% | -- |
| 05/20/2014 05/20/14 | Rented | $1,280 | -1.5% | -- |
| 12/27/2013 12/27/13 | Rented | $1,300 | -7.1% | -- |
| 11/27/2013 11/27/13 | Under Contract | -- | -- | -- |
| 11/20/2013 11/20/13 | For Rent | $1,400 | -- | -- |
| Year | Tax Paid | Tax Assessment Tax Assessment Total Assessment is a certain percentage of the fair market value that is determined by local assessors to be the total taxable value of land and additions on the property. | Land | Improvement |
|---|---|---|---|---|
| 2025 | $2,053 | $13,925 | $2,000 | $11,925 |
| 2024 | $2,053 | $13,925 | $2,000 | $11,925 |
| 2023 | $2,189 | $12,339 | $2,000 | $10,339 |
| 2022 | $209,232 | $12,339 | $2,000 | $10,339 |
| 2021 | $2,091 | $12,339 | $2,000 | $10,339 |
| 2020 | $2,082 | $12,339 | $2,000 | $10,339 |
| 2019 | $1,606 | $9,120 | $1,280 | $7,840 |
| 2018 | $1,610 | $9,120 | $1,280 | $7,840 |
| 2017 | $1,620 | $9,120 | $1,280 | $7,840 |
| 2016 | $1,656 | $9,120 | $1,280 | $7,840 |
| 2015 | $494 | $9,120 | $1,280 | $7,840 |
| 2014 | $520 | $9,120 | $1,280 | $7,840 |
| 2013 | -- | $9,120 | $1,280 | $7,840 |
Landlord's Agent in 2025
Gwen Michon
Century 21 Investment Realty
(985) 502-5952
90 in this area
123 Total Sales
Seller's Agent in 2015
Kimberly Hatcher
ERA Top Agent Realty
(985) 847-1816
16 in this area
27 Total Sales
P
Buyer's Agent in 2013
Patti Palermo
TRiple 3 Realty, LLC
3 in this area
3 Total Sales
Source: ROAM MLS
MLS Number: 2484801
APN: 84859
Ask me questions while you tour the home.