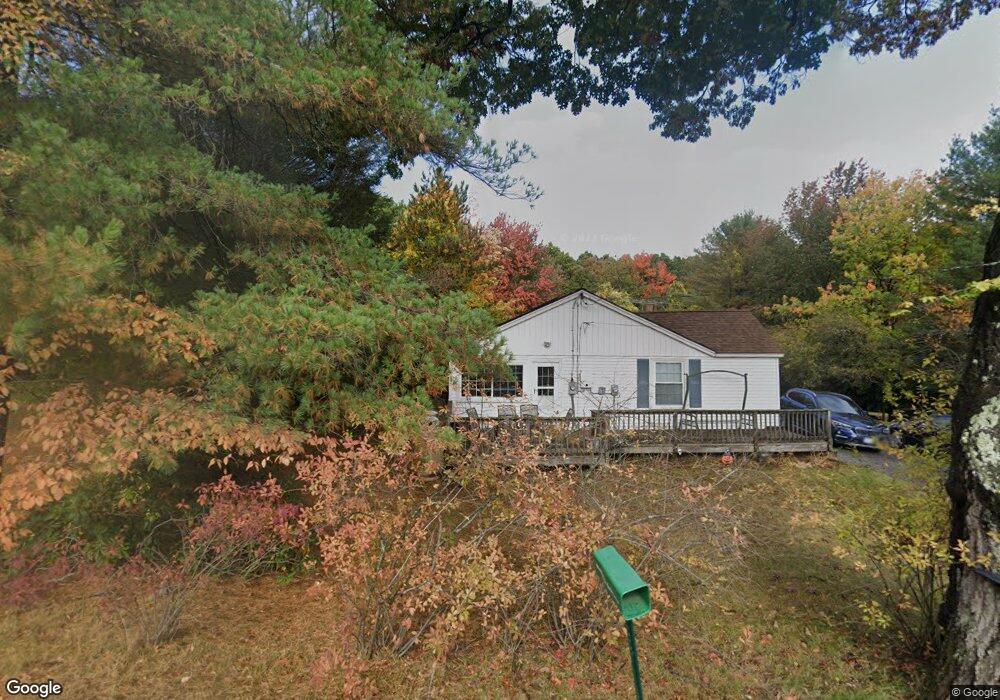
371 Hill St Leominster, MA 01453
Estimated Value: $723,745 - $833,000
5
Beds
4
Baths
2,500
Sq Ft
$306/Sq Ft
Est. Value
About This Home
This home is located at 371 Hill St, Leominster, MA 01453 and is currently estimated at $764,936, approximately $305 per square foot. 371 Hill St is a home located in Worcester County with nearby schools including Leominster High School, St. Leo School, and St. Anna Catholic School.
Ownership History
Date
Name
Owned For
Owner Type
Purchase Details
Closed on
Oct 30, 1998
Sold by
Johansson David V and Johansson Holly
Bought by
Peet J Richard and Hartwick Elaine R
Current Estimated Value
Home Financials for this Owner
Home Financials are based on the most recent Mortgage that was taken out on this home.
Original Mortgage
$172,000
Outstanding Balance
$37,841
Interest Rate
6.68%
Mortgage Type
Purchase Money Mortgage
Estimated Equity
$727,095
Create a Home Valuation Report for This Property
The Home Valuation Report is an in-depth analysis detailing your home's value as well as a comparison with similar homes in the area
Home Values in the Area
Average Home Value in this Area
Purchase History
| Date | Buyer | Sale Price | Title Company |
|---|---|---|---|
| Peet J Richard | $215,000 | -- |
Source: Public Records
Mortgage History
| Date | Status | Borrower | Loan Amount |
|---|---|---|---|
| Open | Peet J Richard | $20,000 | |
| Closed | Peet J Richard | $28,000 | |
| Closed | Peet J Richard | $20,000 | |
| Open | Peet J Richard | $172,000 |
Source: Public Records
Tax History Compared to Growth
Tax History
| Year | Tax Paid | Tax Assessment Tax Assessment Total Assessment is a certain percentage of the fair market value that is determined by local assessors to be the total taxable value of land and additions on the property. | Land | Improvement |
|---|---|---|---|---|
| 2025 | $9,115 | $649,700 | $214,800 | $434,900 |
| 2024 | $8,256 | $569,000 | $204,300 | $364,700 |
| 2023 | $7,708 | $496,000 | $177,600 | $318,400 |
| 2022 | $7,316 | $441,800 | $159,400 | $282,400 |
| 2021 | $7,381 | $407,100 | $132,600 | $274,500 |
| 2020 | $6,958 | $387,000 | $132,600 | $254,400 |
| 2019 | $7,093 | $382,600 | $128,200 | $254,400 |
| 2018 | $7,139 | $369,300 | $124,700 | $244,600 |
| 2017 | $7,385 | $374,300 | $116,600 | $257,700 |
| 2016 | $6,998 | $357,400 | $116,600 | $240,800 |
| 2015 | $6,948 | $357,400 | $116,600 | $240,800 |
| 2014 | $6,560 | $347,300 | $123,000 | $224,300 |
Source: Public Records
Map
Nearby Homes