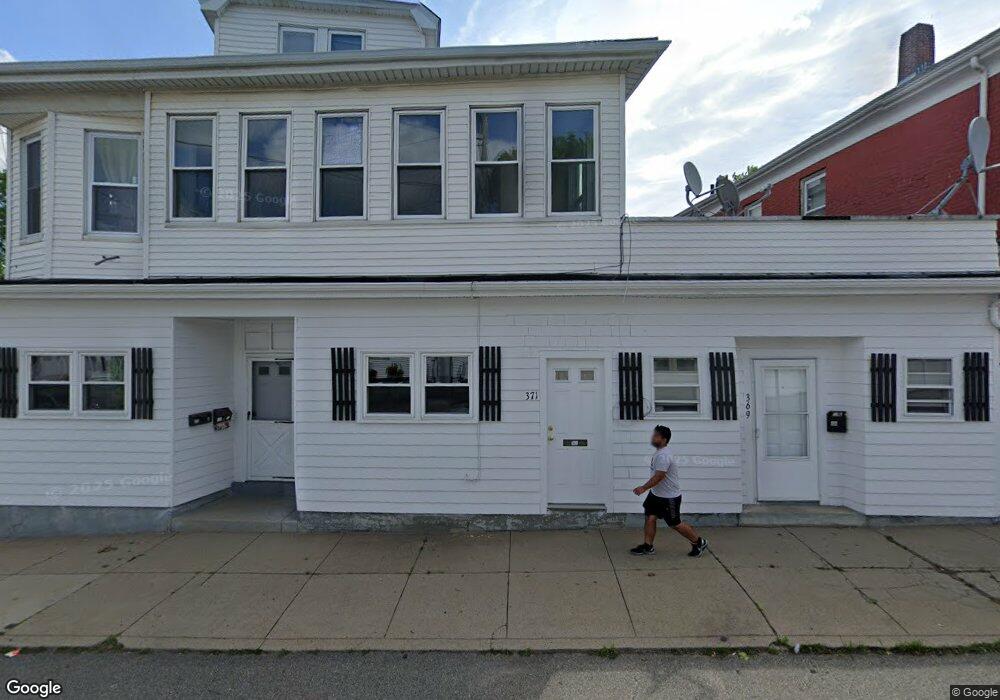
371 Main St Fairhaven, MA 02719
North Fairhaven NeighborhoodEstimated Value: $619,000 - $657,000
6
Beds
3
Baths
3,634
Sq Ft
$175/Sq Ft
Est. Value
About This Home
This home is located at 371 Main St, Fairhaven, MA 02719 and is currently estimated at $635,333, approximately $174 per square foot. 371 Main St is a home located in Bristol County with nearby schools including Fairhaven High School, Alma Del Mar Charter School, and St. Joseph School.
Ownership History
Date
Name
Owned For
Owner Type
Purchase Details
Closed on
Jul 14, 2025
Sold by
Santos Albert
Bought by
New Bedford Inc
Current Estimated Value
Purchase Details
Closed on
Jan 3, 2025
Sold by
Silvana Alphone Lt and Alphonse
Bought by
Santos Albert
Purchase Details
Closed on
Dec 3, 2024
Sold by
Silvana Alphone Lt and Alphones
Bought by
Santos Albert
Purchase Details
Closed on
Jan 30, 2023
Sold by
Alphonse Ft and Alphonse
Bought by
Silvana Alphonse Lt and Alphonse
Create a Home Valuation Report for This Property
The Home Valuation Report is an in-depth analysis detailing your home's value as well as a comparison with similar homes in the area
Home Values in the Area
Average Home Value in this Area
Purchase History
| Date | Buyer | Sale Price | Title Company |
|---|---|---|---|
| New Bedford Inc | -- | -- | |
| New Bedford Inc | -- | -- | |
| New Bedford Inc | -- | -- | |
| Santos Albert | -- | None Available | |
| Santos Albert | -- | None Available | |
| Silvana Alphone Lt | -- | None Available | |
| Silvana Alphone Lt | -- | None Available | |
| Santos Albert | -- | None Available | |
| Silvana Alphone Lt | -- | None Available | |
| Santos Albert | $1,250,000 | None Available | |
| Santos Albert | $1,250,000 | None Available | |
| Santos Albert | $1,250,000 | None Available | |
| Silvana Alphonse Lt | -- | None Available | |
| Silvana Alphonse Lt | -- | None Available | |
| Silvana Alphonse Lt | -- | None Available |
Source: Public Records
Tax History Compared to Growth
Tax History
| Year | Tax Paid | Tax Assessment Tax Assessment Total Assessment is a certain percentage of the fair market value that is determined by local assessors to be the total taxable value of land and additions on the property. | Land | Improvement |
|---|---|---|---|---|
| 2025 | $4,758 | $510,500 | $171,000 | $339,500 |
| 2024 | $4,611 | $499,600 | $171,000 | $328,600 |
| 2023 | $4,524 | $454,700 | $149,800 | $304,900 |
| 2022 | $4,345 | $425,100 | $139,200 | $285,900 |
| 2021 | $4,237 | $375,300 | $125,900 | $249,400 |
| 2020 | $4,151 | $375,300 | $125,900 | $249,400 |
| 2019 | $3,874 | $332,000 | $104,500 | $227,500 |
| 2018 | $3,882 | $326,900 | $99,400 | $227,500 |
| 2017 | $3,809 | $316,400 | $99,400 | $217,000 |
| 2016 | $3,731 | $306,300 | $99,400 | $206,900 |
| 2015 | $3,628 | $298,600 | $99,400 | $199,200 |
Source: Public Records
Map
Nearby Homes