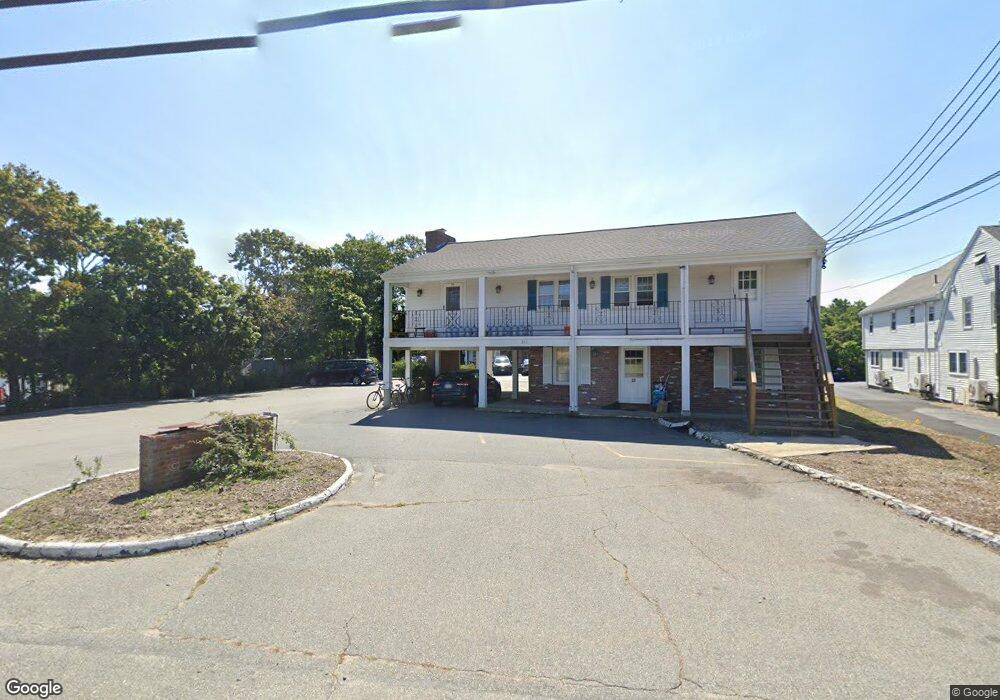
371 Main St Unit 29 West Dennis, MA 02670
West Dennis NeighborhoodEstimated Value: $223,742 - $313,000
1
Bed
1
Bath
460
Sq Ft
$567/Sq Ft
Est. Value
About This Home
This home is located at 371 Main St Unit 29, West Dennis, MA 02670 and is currently estimated at $260,936, approximately $567 per square foot. 371 Main St Unit 29 is a home located in Barnstable County with nearby schools including Dennis-Yarmouth Regional High School and St. Pius X. School.
Ownership History
Date
Name
Owned For
Owner Type
Purchase Details
Closed on
Jun 27, 2014
Sold by
Gafanovich Yuliya
Bought by
Gafanovich Realty Mgmt
Current Estimated Value
Purchase Details
Closed on
Oct 4, 2013
Sold by
Pcjr Realty Llc
Bought by
Gafanovich Yuliya
Purchase Details
Closed on
Dec 13, 2004
Sold by
Seasalt Rt and Cazeault
Bought by
Pcjr Rlty Llc
Purchase Details
Closed on
Aug 31, 2000
Sold by
Scopino Joseph and Scopino Mary
Bought by
Sea Salt Rt
Home Financials for this Owner
Home Financials are based on the most recent Mortgage that was taken out on this home.
Original Mortgage
$40,000
Interest Rate
8.16%
Mortgage Type
Purchase Money Mortgage
Purchase Details
Closed on
Aug 31, 1999
Sold by
Gemborys Steven B
Bought by
Scopino Joseph and Scopino Mary H
Purchase Details
Closed on
Mar 11, 1998
Sold by
Place James R and Place Marilyn J
Bought by
Gemborys Steven B
Home Financials for this Owner
Home Financials are based on the most recent Mortgage that was taken out on this home.
Original Mortgage
$16,762
Interest Rate
7.03%
Mortgage Type
Purchase Money Mortgage
Create a Home Valuation Report for This Property
The Home Valuation Report is an in-depth analysis detailing your home's value as well as a comparison with similar homes in the area
Home Values in the Area
Average Home Value in this Area
Purchase History
| Date | Buyer | Sale Price | Title Company |
|---|---|---|---|
| Gafanovich Realty Mgmt | -- | -- | |
| Gafanovich Realty Mgmt | -- | -- | |
| Gafanovich Realty Mgmt | -- | -- | |
| Gafanovich Yuliya | $51,500 | -- | |
| Pcjr Rlty Llc | -- | -- | |
| Pcjr Rlty Llc | -- | -- | |
| Pcjr Rlty Llc | -- | -- | |
| Sea Salt Rt | $49,000 | -- | |
| Sea Salt Rt | $49,000 | -- | |
| Scopino Joseph | $42,500 | -- | |
| Gemborys Steven B | $22,350 | -- | |
| Gemborys Steven B | $22,350 | -- |
Source: Public Records
Mortgage History
| Date | Status | Borrower | Loan Amount |
|---|---|---|---|
| Previous Owner | Gemborys Steven B | $40,000 | |
| Previous Owner | Gemborys Steven B | $16,762 |
Source: Public Records
Tax History Compared to Growth
Tax History
| Year | Tax Paid | Tax Assessment Tax Assessment Total Assessment is a certain percentage of the fair market value that is determined by local assessors to be the total taxable value of land and additions on the property. | Land | Improvement |
|---|---|---|---|---|
| 2025 | $820 | $189,300 | $0 | $189,300 |
| 2024 | $565 | $128,800 | $0 | $128,800 |
| 2023 | $493 | $105,600 | $0 | $105,600 |
| 2022 | $550 | $98,200 | $0 | $98,200 |
| 2021 | $534 | $88,500 | $0 | $88,500 |
| 2020 | $489 | $80,100 | $0 | $80,100 |
| 2019 | $355 | $57,500 | $0 | $57,500 |
| 2018 | $360 | $56,800 | $0 | $56,800 |
| 2017 | $317 | $51,500 | $0 | $51,500 |
| 2016 | $338 | $51,800 | $0 | $51,800 |
| 2015 | $332 | $51,800 | $0 | $51,800 |
| 2014 | $340 | $53,600 | $0 | $53,600 |
Source: Public Records
Map
Nearby Homes
- 401 Main St Unit 201
- 401 Main St Unit 101
- 23 Doric Ave
- 467 Main St
- 428 Main St Unit 1-11
- 209 Main St Unit 3
- 209 Main St Unit 6
- 209 Main St Unit 1
- 209 Main St Unit 2
- 209 Main St Unit 4
- 209 Main St Unit 5
- 14 Schoolhouse Ln
- 178 School St
- 61 Trotters Ln
- 15 Woodside Park Rd
- 45 Seth Ln
- 3 Pinefield Ln
- 2 Rita Mary Way
- 29 Bass River Rd
- 40 Kelley Rd
- 371 Massachusetts 28 Unit 5
- 371 Massachusetts 28 Unit 17
- 371 Massachusetts 28 Unit 4
- 371 Massachusetts 28 Unit 22
- 371 Massachusetts 28 Unit 9
- 371 Massachusetts 28 Unit 29
- 371 Massachusetts 28 Unit 30
- 371 Massachusetts 28 Unit 19
- 371 Massachusetts 28 Unit 26
- 371 Massachusetts 28 Unit 20
- 371 Main St Unit 28
- 371 Main St Unit 8
- 371 Main Street Rte 28 Unit 17
- 371 Main St Unit 17
- 371 Main St Unit 25
- 371 Main St Unit 15
- 371 Main St Unit 3
- 371 Main St Unit 23
- 371 Main St Unit 18
- 371 Main St Unit 2