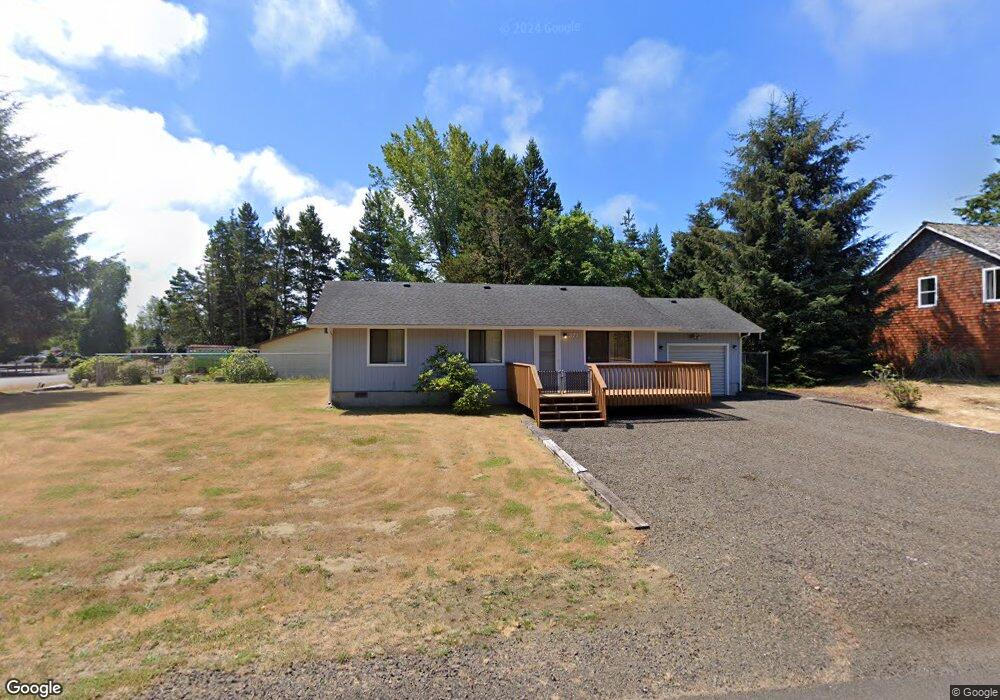
371 Ponderosa Loop NE Ocean Shores, WA 98569
Estimated Value: $236,000 - $343,000
3
Beds
1
Bath
1,092
Sq Ft
$267/Sq Ft
Est. Value
About This Home
This home is located at 371 Ponderosa Loop NE, Ocean Shores, WA 98569 and is currently estimated at $291,957, approximately $267 per square foot. 371 Ponderosa Loop NE is a home located in Grays Harbor County with nearby schools including North Beach Junior/Senior High School.
Ownership History
Date
Name
Owned For
Owner Type
Purchase Details
Closed on
Aug 13, 2009
Sold by
Deutsche Bank National Trust Company
Bought by
Huffman Sam D and Huffman Patricia A
Current Estimated Value
Home Financials for this Owner
Home Financials are based on the most recent Mortgage that was taken out on this home.
Original Mortgage
$81,600
Outstanding Balance
$53,095
Interest Rate
5.17%
Mortgage Type
New Conventional
Estimated Equity
$238,862
Purchase Details
Closed on
Apr 10, 2009
Sold by
Bruneau Timothy A
Bought by
Deutsche Bank National Trust Company
Purchase Details
Closed on
Apr 25, 2006
Sold by
Sandoval Jamie and Sandoval Debra
Bought by
Bruneau Timothy A
Home Financials for this Owner
Home Financials are based on the most recent Mortgage that was taken out on this home.
Original Mortgage
$107,696
Interest Rate
6.29%
Mortgage Type
New Conventional
Create a Home Valuation Report for This Property
The Home Valuation Report is an in-depth analysis detailing your home's value as well as a comparison with similar homes in the area
Home Values in the Area
Average Home Value in this Area
Purchase History
| Date | Buyer | Sale Price | Title Company |
|---|---|---|---|
| Huffman Sam D | $102,000 | Coast Title | |
| Deutsche Bank National Trust Company | $108,851 | Grays Harbor Title | |
| Bruneau Timothy A | $134,620 | Coast Title |
Source: Public Records
Mortgage History
| Date | Status | Borrower | Loan Amount |
|---|---|---|---|
| Open | Huffman Sam D | $81,600 | |
| Previous Owner | Bruneau Timothy A | $107,696 |
Source: Public Records
Tax History Compared to Growth
Tax History
| Year | Tax Paid | Tax Assessment Tax Assessment Total Assessment is a certain percentage of the fair market value that is determined by local assessors to be the total taxable value of land and additions on the property. | Land | Improvement |
|---|---|---|---|---|
| 2025 | $1,565 | $247,220 | $45,000 | $202,220 |
| 2023 | $1,579 | $242,260 | $75,000 | $167,260 |
| 2022 | $1,472 | $174,176 | $54,200 | $119,976 |
| 2021 | $1,573 | $174,176 | $54,200 | $119,976 |
| 2020 | $1,470 | $152,352 | $37,375 | $114,977 |
| 2019 | $1,357 | $137,024 | $32,500 | $104,524 |
| 2018 | $1,317 | $123,183 | $25,000 | $98,183 |
| 2017 | $1,112 | $113,011 | $25,000 | $88,011 |
| 2016 | $1,026 | $93,345 | $22,000 | $71,345 |
| 2014 | -- | $89,640 | $12,000 | $77,640 |
| 2013 | -- | $99,820 | $15,000 | $84,820 |
Source: Public Records
Map
Nearby Homes
- 445 Bass Ave NE
- 470 Lake West Loop NE
- 441 Bass Ave NE
- 430 Dolphin Ave NE
- 433 Dolphin Ave NE
- 457 Dolphin Ave NE
- 413 Lakeview Loop NE
- 337 Hyde Ct NE
- 314 Lakeview Loop NE
- 308 Lakeview Loop NE
- 366 Lakeview Loop NE
- 360 Lakeview Loop NE
- 394 Lakeview Loop NE
- 336 Hyde Ct NE
- 260 Dolphin Ave NE
- 276 Bass Ave NE
- 387 Duck Lake Dr NE
- 359 Duck Lake Dr NE
- 247 Bass Ave NE
- 341 Duck Lake Dr NE
- 365 Ponderosa Loop NE
- 399 Ponderosa Loop NE
- 392 Bass Ave NE
- 361 Ponderosa Loop NE
- 386 Ponderosa Loop NE
- 390 Ponderosa Loop NE
- 384 Bass Ave NE
- 380 Ponderosa Loop NE
- 370 Ponderosa Loop NE
- 372 Ponderosa Loop NE
- 376 Ponderosa Loop NE
- 364 Ponderosa Loop NE
- 376 Bass Ave NE
- 360 Ponderosa Loop NE
- 422 Lakewest Loop NE
- 422 Lake West Loop NE
- 370 Bass Ave NE