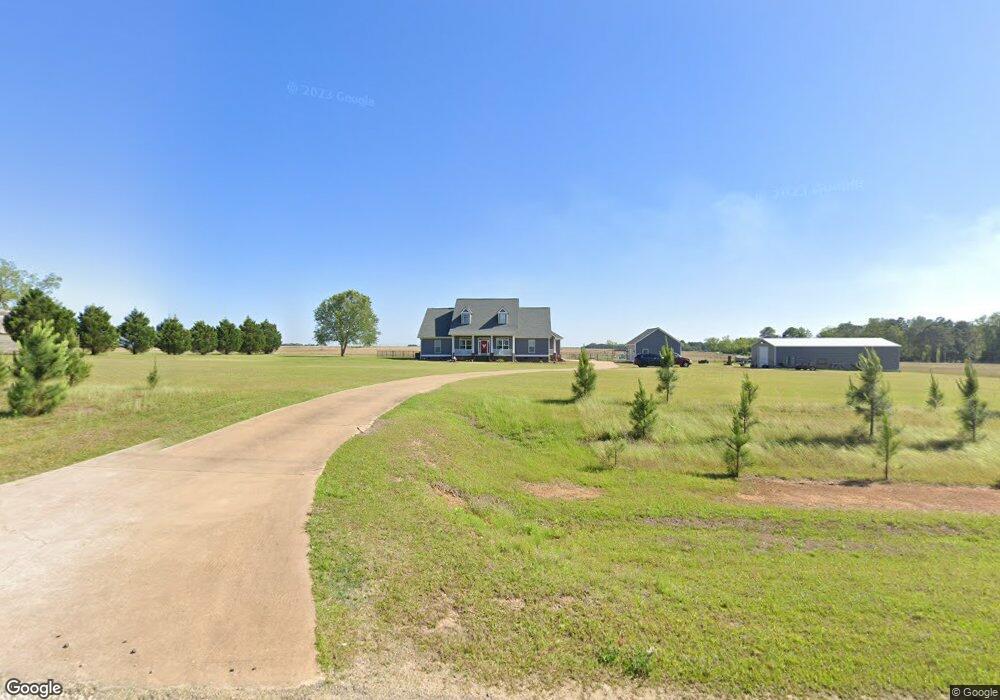
371 Porters Corner Rd Sylvester, GA 31791
Estimated Value: $272,000 - $534,000
3
Beds
3
Baths
2,454
Sq Ft
$164/Sq Ft
Est. Value
About This Home
This home is located at 371 Porters Corner Rd, Sylvester, GA 31791 and is currently estimated at $401,889, approximately $163 per square foot. 371 Porters Corner Rd is a home located in Worth County with nearby schools including Worth County Primary School, Worth County Elementary School, and Worth County Middle School.
Ownership History
Date
Name
Owned For
Owner Type
Purchase Details
Closed on
Nov 25, 2019
Sold by
Hembree Gerry Leland
Bought by
Powell Luke P and Powell Chasity Raburn
Current Estimated Value
Home Financials for this Owner
Home Financials are based on the most recent Mortgage that was taken out on this home.
Original Mortgage
$247,500
Outstanding Balance
$217,337
Interest Rate
3.75%
Mortgage Type
New Conventional
Estimated Equity
$184,552
Purchase Details
Closed on
Dec 21, 2007
Sold by
Knowles Teresa K
Bought by
Hembree Gerry Leland
Home Financials for this Owner
Home Financials are based on the most recent Mortgage that was taken out on this home.
Original Mortgage
$205,000
Interest Rate
6.15%
Mortgage Type
New Conventional
Purchase Details
Closed on
Nov 29, 2005
Sold by
Knowles Teresa K
Bought by
Knowles James A
Purchase Details
Closed on
Jun 9, 2005
Sold by
Purvis Woodrow W
Bought by
Knowles Teresa K
Create a Home Valuation Report for This Property
The Home Valuation Report is an in-depth analysis detailing your home's value as well as a comparison with similar homes in the area
Home Values in the Area
Average Home Value in this Area
Purchase History
| Date | Buyer | Sale Price | Title Company |
|---|---|---|---|
| Powell Luke P | $275,000 | -- | |
| Hembree Gerry Leland | $260,000 | -- | |
| Knowles James A | -- | -- | |
| Knowles Teresa K | -- | -- |
Source: Public Records
Mortgage History
| Date | Status | Borrower | Loan Amount |
|---|---|---|---|
| Open | Powell Luke P | $247,500 | |
| Previous Owner | Hembree Gerry Leland | $205,000 |
Source: Public Records
Tax History Compared to Growth
Tax History
| Year | Tax Paid | Tax Assessment Tax Assessment Total Assessment is a certain percentage of the fair market value that is determined by local assessors to be the total taxable value of land and additions on the property. | Land | Improvement |
|---|---|---|---|---|
| 2024 | $3,607 | $114,373 | $7,123 | $107,250 |
| 2023 | $3,607 | $115,123 | $7,123 | $108,000 |
| 2022 | $3,631 | $115,123 | $7,123 | $108,000 |
| 2021 | $3,477 | $115,123 | $7,123 | $108,000 |
| 2020 | $3,335 | $115,123 | $7,123 | $108,000 |
| 2019 | $3,482 | $115,123 | $7,123 | $108,000 |
| 2018 | $2,300 | $80,267 | $7,123 | $73,144 |
| 2017 | $2,300 | $80,267 | $7,123 | $73,144 |
| 2016 | $2,244 | $80,267 | $7,123 | $73,144 |
| 2015 | $2,248 | $80,267 | $7,123 | $73,144 |
| 2014 | $2,248 | $80,267 | $7,123 | $73,144 |
| 2013 | -- | $79,349 | $6,205 | $73,144 |
| 2012 | -- | $79,348 | $6,204 | $73,144 |
Source: Public Records
Map
Nearby Homes
- 734 Porters Corner Rd
- 702 New Bethel Church Rd
- 710 S Jefferson St
- 107 Gardner Rd
- 103 N Ayers St
- 302 Sadler St
- 314 E Hobson St
- 307 E Hobson St
- 0 W Pinson St Unit 10582366
- 307 E Pope St
- 101 Pecan St
- 000 Georgia 256
- 202 N Westberry St
- 1432 S Ga Hwy 33s
- 316 Bell Rd
- 202A E Welch St
- 0 Multiple Lots Unit 138826
- 128 Airport Rd
- 402 N McPhaul St
- 101 Elm St
- 361 Porters Corner Rd
- 357 Porters Corner Rd
- 421 Porters Corner Rd
- 330 Porters Corner Rd
- 177 Gordy Ln
- 159 Gordy Ln
- 185 Gordy Ln
- 2525 Us Highway 82 W
- 238 Porters Corner Rd
- 542 Porters Corner Rd
- 359 Gunter Rd
- 574 Porters Corner Rd
- 2707 Ga Highway 112 S
- 1654 Massey Airport Rd
- 204 Porters Corner Rd
- 1644 Massey Airport Rd
- 1634 Massey Airport Rd
- 612 Porters Corner Rd
- 2406 Ga Highway 112 S
- 1628 Massey Airport Rd