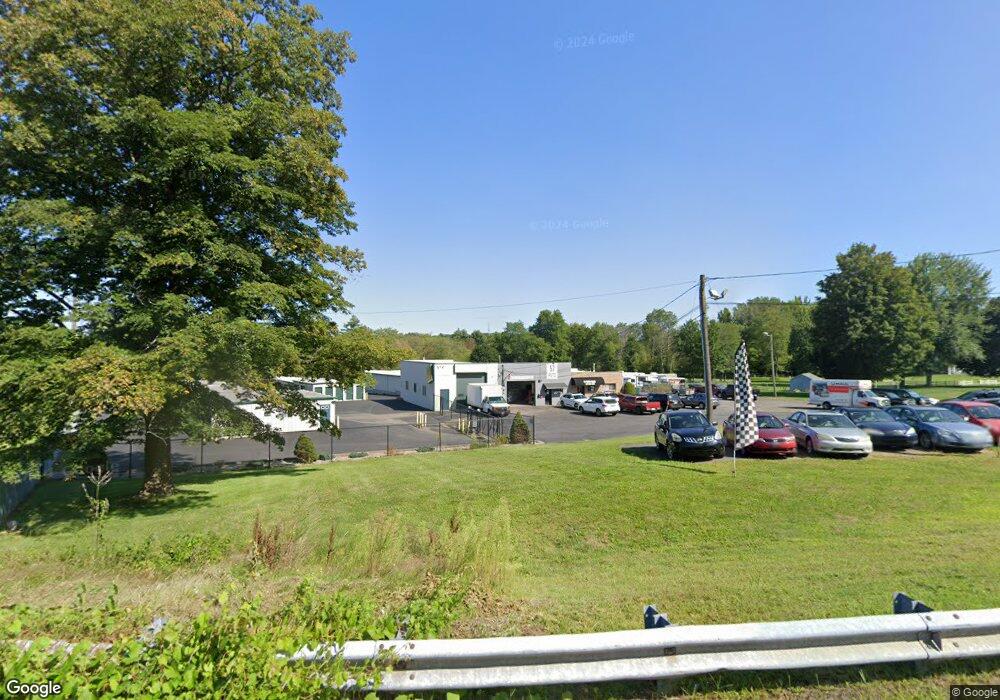
371 S Westfield St Agawam, MA 01030
Estimated Value: $2,603,977
--
Bed
--
Bath
--
Sq Ft
1.32
Acres
About This Home
This home is located at 371 S Westfield St, Agawam, MA 01030 and is currently estimated at $2,603,977. 371 S Westfield St is a home located in Hampden County with nearby schools including Agawam Junior High School and Agawam High School.
Ownership History
Date
Name
Owned For
Owner Type
Purchase Details
Closed on
Jun 6, 2022
Sold by
Chiarella Luigi
Bought by
371 S Westfield Llc
Current Estimated Value
Home Financials for this Owner
Home Financials are based on the most recent Mortgage that was taken out on this home.
Original Mortgage
$2,300,000
Outstanding Balance
$2,185,190
Interest Rate
5.1%
Mortgage Type
Purchase Money Mortgage
Estimated Equity
$418,787
Create a Home Valuation Report for This Property
The Home Valuation Report is an in-depth analysis detailing your home's value as well as a comparison with similar homes in the area
Home Values in the Area
Average Home Value in this Area
Purchase History
| Date | Buyer | Sale Price | Title Company |
|---|---|---|---|
| 371 S Westfield Llc | $2,320,000 | None Available | |
| 371 S Westfield Llc | $2,320,000 | None Available |
Source: Public Records
Mortgage History
| Date | Status | Borrower | Loan Amount |
|---|---|---|---|
| Open | 371 S Westfield Llc | $2,300,000 | |
| Closed | 371 S Westfield Llc | $2,300,000 |
Source: Public Records
Tax History Compared to Growth
Tax History
| Year | Tax Paid | Tax Assessment Tax Assessment Total Assessment is a certain percentage of the fair market value that is determined by local assessors to be the total taxable value of land and additions on the property. | Land | Improvement |
|---|---|---|---|---|
| 2025 | $0 | $1,275,800 | $152,100 | $1,123,700 |
| 2024 | $35,651 | $1,286,100 | $152,100 | $1,134,000 |
| 2023 | $0 | $1,169,200 | $133,100 | $1,036,100 |
| 2022 | $34,166 | $1,077,200 | $121,000 | $956,200 |
| 2021 | $34,166 | $1,058,600 | $87,600 | $971,000 |
| 2020 | $34,166 | $1,069,300 | $87,600 | $981,700 |
| 2019 | $33,861 | $1,060,800 | $87,600 | $973,200 |
| 2018 | $28,811 | $915,500 | $87,600 | $827,900 |
| 2017 | $27,912 | $896,900 | $87,600 | $809,300 |
| 2016 | $26,889 | $896,900 | $87,600 | $809,300 |
| 2015 | $23,469 | $829,600 | $87,600 | $742,000 |
Source: Public Records
Map
Nearby Homes
- 236 S Westfield St
- 907 Shoemaker Ln
- 30 Rising St
- 309 Poplar St
- 8 Independence Rd
- 61-63 Orlando St
- 36-38 Orlando St
- 4 Maple View Ln Unit C
- 114 S West St
- 26 Dutchmaster Dr
- 50 Muriel Ln
- 51 Bradford Dr
- 14 Granger Dr
- 215 Barry St
- 92 Highland St
- 157 Cambridge St
- 461 Southwick St
- 30 Kathy Terrace
- 92 Juniper Ridge Dr
- 441 Silver St
- 385 S Westfield St
- 397 S Westfield St
- 394 S Westfield St
- 408 S Westfield St
- 414 S Westfield St
- 417 S Westfield St
- 400 S Westfield St
- 422 S Westfield St
- 425 S Westfield St
- 418 S Westfield St
- 430 S Westfield St Unit 432
- 437 S Westfield St
- 1 Hendom Dr
- 5 Hendom Dr
- 466 S Westfield St
- 7 Hendom Dr
- 267 S Westfield St
- 270 S Westfield St
- 268 S Westfield St
- 6 Elmar Dr