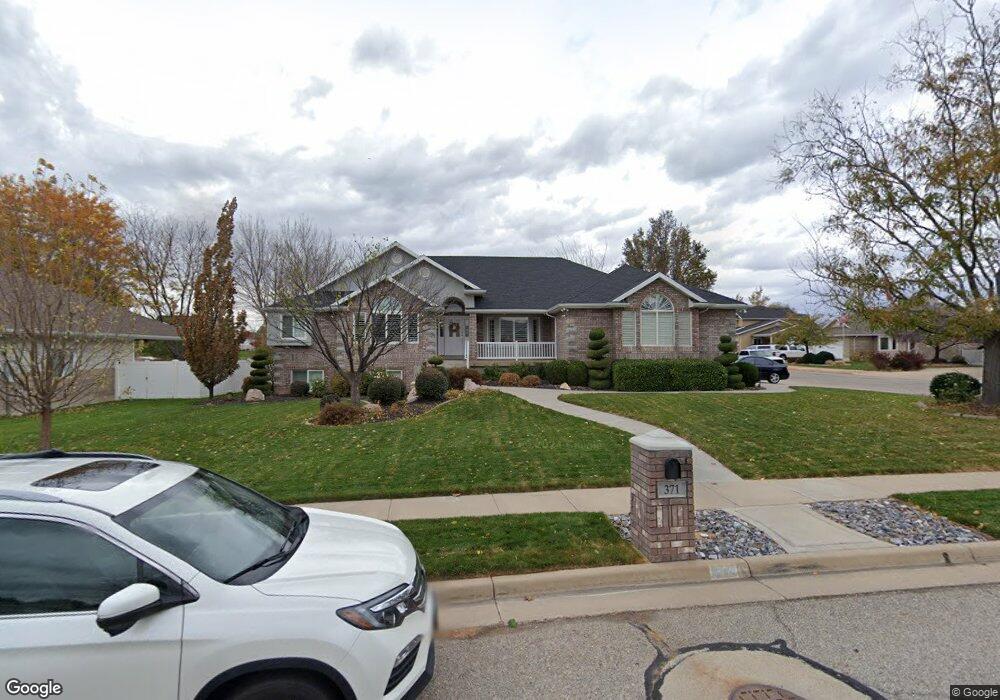
371 Seemore Dr Kaysville, UT 84037
West Kaysville NeighborhoodEstimated Value: $901,000 - $1,060,000
4
Beds
4
Baths
4,458
Sq Ft
$222/Sq Ft
Est. Value
About This Home
This home is located at 371 Seemore Dr, Kaysville, UT 84037 and is currently estimated at $988,003, approximately $221 per square foot. 371 Seemore Dr is a home located in Davis County with nearby schools including Kay's Creek Elementary School, Shoreline Junior High School, and Davis High School.
Ownership History
Date
Name
Owned For
Owner Type
Purchase Details
Closed on
Nov 26, 2012
Sold by
Moultrie C Tim and Moultrie Kathleen R
Bought by
Moultrie Kathleen Rae and Moultrie Charles Timothy
Current Estimated Value
Purchase Details
Closed on
Feb 16, 1999
Sold by
Green L Dale
Bought by
Moultrie C Tim and Moultrie Kathleen R
Home Financials for this Owner
Home Financials are based on the most recent Mortgage that was taken out on this home.
Original Mortgage
$90,000
Interest Rate
6.43%
Purchase Details
Closed on
Sep 18, 1998
Sold by
Ed Green Construction Inc and Green L Dale
Bought by
Green L Dale
Home Financials for this Owner
Home Financials are based on the most recent Mortgage that was taken out on this home.
Original Mortgage
$200,000
Interest Rate
6.89%
Mortgage Type
Construction
Create a Home Valuation Report for This Property
The Home Valuation Report is an in-depth analysis detailing your home's value as well as a comparison with similar homes in the area
Home Values in the Area
Average Home Value in this Area
Purchase History
| Date | Buyer | Sale Price | Title Company |
|---|---|---|---|
| Moultrie Kathleen Rae | -- | None Available | |
| Moultrie C Tim | -- | Security Title Company | |
| Green L Dale | -- | Security Title |
Source: Public Records
Mortgage History
| Date | Status | Borrower | Loan Amount |
|---|---|---|---|
| Closed | Moultrie C Tim | $90,000 | |
| Previous Owner | Green L Dale | $200,000 |
Source: Public Records
Tax History Compared to Growth
Tax History
| Year | Tax Paid | Tax Assessment Tax Assessment Total Assessment is a certain percentage of the fair market value that is determined by local assessors to be the total taxable value of land and additions on the property. | Land | Improvement |
|---|---|---|---|---|
| 2025 | $4,319 | $478,500 | $225,552 | $252,948 |
| 2024 | $4,319 | $455,401 | $222,426 | $232,975 |
| 2023 | $4,263 | $796,000 | $384,015 | $411,985 |
| 2022 | $4,037 | $422,950 | $208,997 | $213,953 |
| 2021 | $3,872 | $608,000 | $258,687 | $349,313 |
| 2020 | $3,519 | $538,000 | $222,986 | $315,014 |
| 2019 | $3,383 | $508,000 | $215,602 | $292,398 |
| 2018 | $3,380 | $506,000 | $185,322 | $320,678 |
| 2016 | $2,838 | $223,300 | $89,590 | $133,710 |
| 2015 | $3,068 | $229,179 | $89,590 | $139,589 |
| 2014 | $3,206 | $217,800 | $67,211 | $150,589 |
| 2013 | -- | $195,946 | $57,578 | $138,368 |
Source: Public Records
Map
Nearby Homes
- 256 Seemore Dr
- 1429 W Lincoln Way
- 71 S Harvs Ln
- 129 N Mountain Vistas Rd
- 1845 W Sherri Ln
- 51 N Hayfield Cir
- 1566 Pheasant Meadow Dr
- Yalecrest Plan at The Preserve
- Trio Plan at The Preserve
- Timpani Plan at The Preserve
- Tenor Plan at The Preserve
- Octave Plan at The Preserve
- Madrigal Plan at The Preserve
- Interlude Plan at The Preserve
- Harvard Plan at The Preserve
- Harrison Plan at The Preserve
- Fortissimo Plan at The Preserve
- Forte Plan at The Preserve
- Finale Plan at The Preserve
- Canon Plan at The Preserve