371 W 300 N American Fork, UT 84003
Estimated Value: $433,000 - $451,000
3
Beds
2
Baths
1,339
Sq Ft
$329/Sq Ft
Est. Value
About This Home
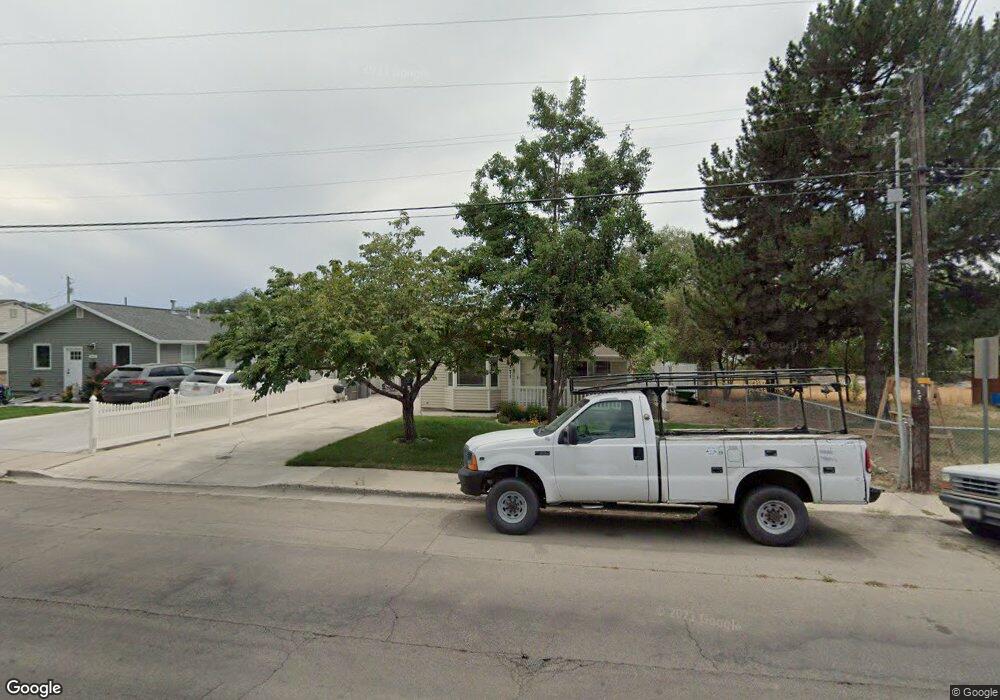
This home is located at 371 W 300 N, American Fork, UT 84003 and is currently estimated at $440,550, approximately $329 per square foot. 371 W 300 N is a home located in Utah County with nearby schools including Shelley Elementary School, American Fork Junior High School, and American Fork High School.
Ownership History
Date
Name
Owned For
Owner Type
Purchase Details
Closed on
Jun 4, 2020
Sold by
Christensen Nathan and Christensen Katlynn
Bought by
Vangilder Jeremy and Vangilder Van Gilder
Current Estimated Value
Home Financials for this Owner
Home Financials are based on the most recent Mortgage that was taken out on this home.
Original Mortgage
$277,400
Outstanding Balance
$245,894
Interest Rate
3.2%
Mortgage Type
New Conventional
Estimated Equity
$194,656
Purchase Details
Closed on
Dec 11, 2017
Sold by
Christensen Christopher C
Bought by
Christensen Christopher C and Christensen Whitney K
Home Financials for this Owner
Home Financials are based on the most recent Mortgage that was taken out on this home.
Original Mortgage
$39,500
Interest Rate
3.94%
Mortgage Type
Credit Line Revolving
Purchase Details
Closed on
Jan 13, 2014
Sold by
Sheriff Colby
Bought by
Christensen Nathan and Christensen Katlynn
Home Financials for this Owner
Home Financials are based on the most recent Mortgage that was taken out on this home.
Original Mortgage
$162,360
Interest Rate
4.75%
Mortgage Type
Adjustable Rate Mortgage/ARM
Purchase Details
Closed on
May 3, 2011
Sold by
Fannie Mae
Bought by
Sheriff Colby
Home Financials for this Owner
Home Financials are based on the most recent Mortgage that was taken out on this home.
Original Mortgage
$112,084
Interest Rate
4.75%
Mortgage Type
FHA
Purchase Details
Closed on
Feb 3, 2011
Sold by
Johnson George and Johnson Gay
Bought by
Federal National Mortgage Association
Purchase Details
Closed on
Jun 22, 2004
Sold by
Hunter Tyler D and Hunter Ruby
Bought by
Johnson George and Johnson Gay
Home Financials for this Owner
Home Financials are based on the most recent Mortgage that was taken out on this home.
Original Mortgage
$109,200
Interest Rate
6.29%
Mortgage Type
Purchase Money Mortgage
Purchase Details
Closed on
Nov 5, 2002
Sold by
Gray Jeffrey H and Gray Tonia D
Bought by
Hunter Tyler D and Hunter Ruby
Purchase Details
Closed on
Nov 9, 2001
Sold by
Gray Jeffrey H
Bought by
Gray Jeffrey H and Gray Tonia D
Home Financials for this Owner
Home Financials are based on the most recent Mortgage that was taken out on this home.
Original Mortgage
$114,900
Interest Rate
6.62%
Purchase Details
Closed on
Oct 15, 1998
Sold by
Burnham Rafer and Burnham Maria
Bought by
Gray Jeffrey H
Home Financials for this Owner
Home Financials are based on the most recent Mortgage that was taken out on this home.
Original Mortgage
$89,600
Interest Rate
6.79%
Create a Home Valuation Report for This Property
The Home Valuation Report is an in-depth analysis detailing your home's value as well as a comparison with similar homes in the area
Home Values in the Area
Average Home Value in this Area
Purchase History
| Date | Buyer | Sale Price | Title Company |
|---|---|---|---|
| Vangilder Jeremy | -- | Frontier Title Ins Agency In | |
| Christensen Christopher C | -- | Meridian Title Corp | |
| Christensen Nathan | -- | First American Title Co Llc | |
| Sheriff Colby | -- | Empire Land Title Inc | |
| Federal National Mortgage Association | $113,219 | Accommodation | |
| Johnson George | -- | Guardian Title Company Of U | |
| Hunter Tyler D | -- | Timp Title Insurance Agency | |
| Gray Jeffrey H | -- | First American Title Ins Co | |
| Gray Jeffrey H | -- | -- |
Source: Public Records
Mortgage History
| Date | Status | Borrower | Loan Amount |
|---|---|---|---|
| Open | Vangilder Jeremy | $277,400 | |
| Previous Owner | Christensen Christopher C | $39,500 | |
| Previous Owner | Christensen Nathan | $162,360 | |
| Previous Owner | Sheriff Colby | $112,084 | |
| Previous Owner | Johnson George | $109,200 | |
| Previous Owner | Gray Jeffrey H | $114,900 | |
| Previous Owner | Gray Jeffrey H | $89,600 | |
| Closed | Johnson George | $20,450 |
Source: Public Records
Tax History Compared to Growth
Tax History
| Year | Tax Paid | Tax Assessment Tax Assessment Total Assessment is a certain percentage of the fair market value that is determined by local assessors to be the total taxable value of land and additions on the property. | Land | Improvement |
|---|---|---|---|---|
| 2025 | $1,659 | $206,635 | $177,200 | $198,500 |
| 2024 | $1,659 | $184,305 | $0 | $0 |
| 2023 | $1,516 | $178,530 | $0 | $0 |
| 2022 | $1,648 | $191,620 | $0 | $0 |
| 2021 | $1,406 | $255,300 | $127,100 | $128,200 |
| 2020 | $1,312 | $231,100 | $113,500 | $117,600 |
| 2019 | $1,169 | $213,000 | $97,300 | $115,700 |
| 2018 | $1,103 | $192,100 | $87,600 | $104,500 |
| 2017 | $1,026 | $96,415 | $0 | $0 |
| 2016 | $937 | $81,785 | $0 | $0 |
| 2015 | $966 | $80,080 | $0 | $0 |
| 2014 | $884 | $72,270 | $0 | $0 |
Source: Public Records
Map
Nearby Homes
- 370 W Pacific Dr Unit 1
- 399 W Pacific Dr
- 356 N 480 W
- 120 N 350 W Unit 127
- 120 N 350 W Unit 133
- 120 N 350 W Unit 130
- 540 N 300 W
- 365 N 100 W
- 129 W Pacific Dr
- 105 N 100 W
- 217 W Main St
- 641 N 420 W
- 55 Roosevelt Ave
- 351 Washington Ave
- 82 S Lincoln Ave
- 374 N Center St
- 55 S 200 W
- 621 N 100 W
- 777 W State Rd
- 396 N 100 E