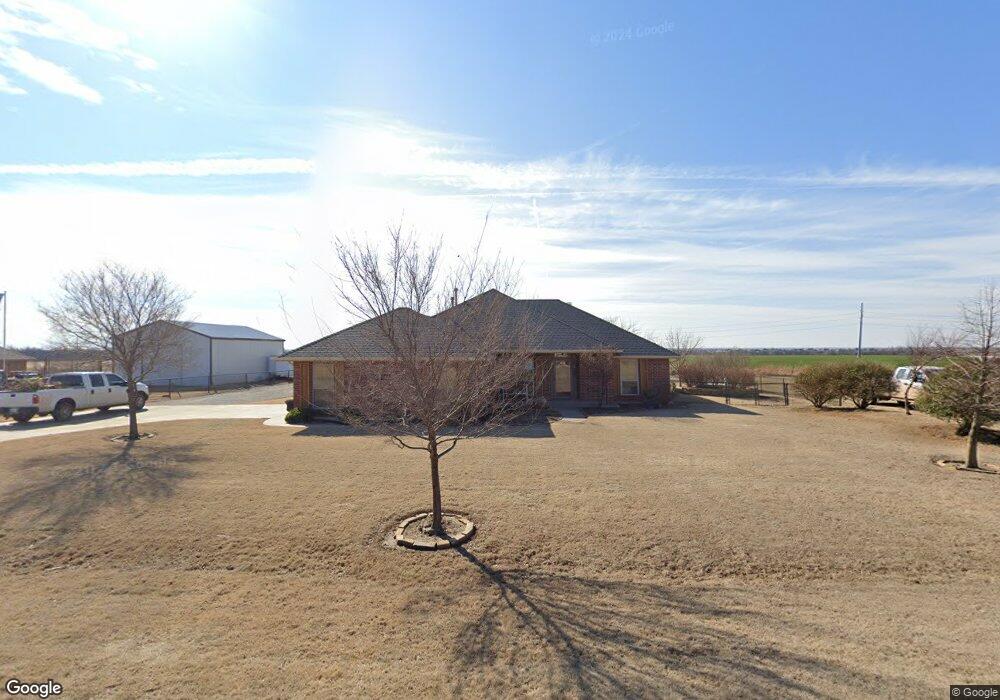
3710 Chuck Wagon Rd Piedmont, OK 73078
Estimated Value: $298,000 - $313,000
3
Beds
2
Baths
1,746
Sq Ft
$175/Sq Ft
Est. Value
About This Home
This home is located at 3710 Chuck Wagon Rd, Piedmont, OK 73078 and is currently estimated at $305,562, approximately $175 per square foot. 3710 Chuck Wagon Rd is a home located in Canadian County with nearby schools including Stone Ridge Elementary School, Piedmont Intermediate Elementary School, and Piedmont Middle School.
Ownership History
Date
Name
Owned For
Owner Type
Purchase Details
Closed on
Oct 29, 2010
Sold by
Parrish Debra Joy and Debra Joy Parrish Revocable Tr
Bought by
Sprague Aaron L and Sprague Cami
Current Estimated Value
Home Financials for this Owner
Home Financials are based on the most recent Mortgage that was taken out on this home.
Original Mortgage
$90,000
Outstanding Balance
$59,652
Interest Rate
4.36%
Mortgage Type
New Conventional
Estimated Equity
$245,910
Purchase Details
Closed on
Jun 1, 2009
Sold by
Parrish Debra J
Bought by
Parrish Debra Joy and Debra Joy Parrish Revocable Tr
Purchase Details
Closed on
Nov 14, 2007
Sold by
Boevers Homes Llc
Bought by
Parrish Debra J
Home Financials for this Owner
Home Financials are based on the most recent Mortgage that was taken out on this home.
Original Mortgage
$141,930
Interest Rate
6.38%
Mortgage Type
New Conventional
Purchase Details
Closed on
Mar 27, 2007
Sold by
Circle V Ranch Estates Llc
Bought by
Boevers Homes Llc
Create a Home Valuation Report for This Property
The Home Valuation Report is an in-depth analysis detailing your home's value as well as a comparison with similar homes in the area
Home Values in the Area
Average Home Value in this Area
Purchase History
| Date | Buyer | Sale Price | Title Company |
|---|---|---|---|
| Sprague Aaron L | $163,500 | American Eagle Title Ins Co | |
| Parrish Debra Joy | -- | None Available | |
| Parrish Debra J | $1,121,250 | None Available | |
| Boevers Homes Llc | -- | None Available |
Source: Public Records
Mortgage History
| Date | Status | Borrower | Loan Amount |
|---|---|---|---|
| Open | Sprague Aaron L | $90,000 | |
| Previous Owner | Parrish Debra J | $141,930 |
Source: Public Records
Tax History Compared to Growth
Tax History
| Year | Tax Paid | Tax Assessment Tax Assessment Total Assessment is a certain percentage of the fair market value that is determined by local assessors to be the total taxable value of land and additions on the property. | Land | Improvement |
|---|---|---|---|---|
| 2024 | $2,755 | $27,733 | $3,000 | $24,733 |
| 2023 | $2,755 | $26,925 | $3,000 | $23,925 |
| 2022 | $2,698 | $26,141 | $3,000 | $23,141 |
| 2021 | $2,711 | $25,380 | $3,000 | $22,380 |
| 2020 | $2,674 | $24,641 | $3,000 | $21,641 |
| 2019 | $2,475 | $24,034 | $3,000 | $21,034 |
| 2018 | $2,432 | $23,334 | $3,000 | $20,334 |
| 2017 | $2,385 | $22,993 | $2,968 | $20,025 |
| 2016 | $2,232 | $22,994 | $2,949 | $20,045 |
| 2015 | $1,776 | $21,674 | $2,864 | $18,810 |
| 2014 | $1,776 | $18,829 | $2,489 | $16,340 |
Source: Public Records
Map
Nearby Homes
- 3632 Chuck Wagon Rd
- 3730 Ruby Ridge NE
- 3405 Faint Ridge Way
- 2909 Old Wagon Rd
- 4162 Hawthorne St
- 0 Edmond Rd NE
- 0 NE Morgan Road Tract 17
- 3117 Turkey Creek Ln NE
- 722 Venetian Ave
- 4144 Reta Cir
- 664 Paris Ave
- 3919 Morgan Rd NE
- 664 Venetian Ave
- 546 Paris Ave
- 4095 Richards Way
- 604 Venetian Ave
- 478 Paris Ave
- 545 Venetian Ave
- 444 Paris Ave
- 4094 Richards Way
- 3670 Chuck Wagon Rd
- 3786 Chuck Wagon Rd
- 3707 Chuck Wagon Rd NE
- 2487 Parker Ridge
- 2487 Faint Ridge Way
- 3629 Chuck Wagon Rd
- 2529 Parker Ridge
- 2525 Faint Ridge Way NE
- 3824 Chuck Wagon Rd
- 3862 Chuck Wagon Rd NE
- 2556 Faint Ridge Way NE
- 2486 Parker Ridge
- 2454 Painted Wagon Cir
- 2528 Parker Ridge
- 2573 Faint Ridge Way
- 2572 Parker Ridge
- 2572 Parker Ridge
- 3606 Ruby Ridge NE
- 2512 Painted Wagon
- 2485 Parker Mill Trail