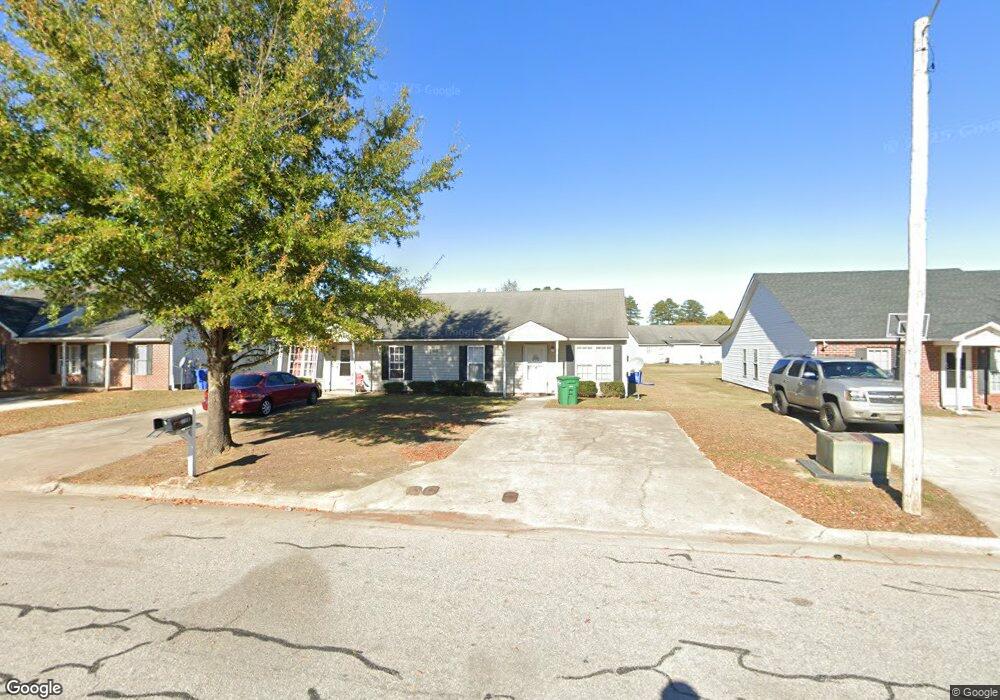
3710 Lear Ct NW Wilson, NC 27896
Estimated Value: $198,000 - $333,000
--
Bed
6
Baths
1,821
Sq Ft
$140/Sq Ft
Est. Value
About This Home
This home is located at 3710 Lear Ct NW, Wilson, NC 27896 and is currently estimated at $254,767, approximately $139 per square foot. 3710 Lear Ct NW is a home located in Wilson County with nearby schools including New Hope Elementary School, Elm City Middle School, and Fike High School.
Ownership History
Date
Name
Owned For
Owner Type
Purchase Details
Closed on
Aug 16, 2022
Sold by
Jonathan Garrett Llc
Bought by
Garrett Properties Llc
Current Estimated Value
Home Financials for this Owner
Home Financials are based on the most recent Mortgage that was taken out on this home.
Original Mortgage
$129,600
Outstanding Balance
$123,934
Interest Rate
5.54%
Mortgage Type
New Conventional
Estimated Equity
$130,833
Purchase Details
Closed on
Feb 25, 2021
Sold by
Barnes Angela D and Barnes Torase L
Bought by
Jonathan Garrett Llc
Home Financials for this Owner
Home Financials are based on the most recent Mortgage that was taken out on this home.
Original Mortgage
$125,000
Interest Rate
2.7%
Mortgage Type
Commercial
Purchase Details
Closed on
Mar 14, 2005
Sold by
Rdjd Properties Llc
Bought by
Barnes Angela D
Home Financials for this Owner
Home Financials are based on the most recent Mortgage that was taken out on this home.
Original Mortgage
$24,300
Interest Rate
5.6%
Mortgage Type
Commercial
Create a Home Valuation Report for This Property
The Home Valuation Report is an in-depth analysis detailing your home's value as well as a comparison with similar homes in the area
Home Values in the Area
Average Home Value in this Area
Purchase History
| Date | Buyer | Sale Price | Title Company |
|---|---|---|---|
| Garrett Properties Llc | -- | None Listed On Document | |
| Jonathan Garrett Llc | $122,000 | None Available | |
| Barnes Angela D | $121,500 | -- |
Source: Public Records
Mortgage History
| Date | Status | Borrower | Loan Amount |
|---|---|---|---|
| Open | Garrett Properties Llc | $129,600 | |
| Previous Owner | Jonathan Garrett Llc | $125,000 | |
| Previous Owner | Barnes Angela D | $24,300 |
Source: Public Records
Tax History Compared to Growth
Tax History
| Year | Tax Paid | Tax Assessment Tax Assessment Total Assessment is a certain percentage of the fair market value that is determined by local assessors to be the total taxable value of land and additions on the property. | Land | Improvement |
|---|---|---|---|---|
| 2025 | $2,359 | $210,582 | $40,000 | $170,582 |
| 2024 | $2,359 | $210,582 | $40,000 | $170,582 |
| 2023 | $1,587 | $121,623 | $29,000 | $92,623 |
| 2022 | $0 | $121,623 | $29,000 | $92,623 |
| 2021 | $1,587 | $121,623 | $29,000 | $92,623 |
| 2020 | $1,587 | $121,623 | $29,000 | $92,623 |
| 2019 | $1,587 | $121,623 | $29,000 | $92,623 |
| 2018 | $1,587 | $121,623 | $29,000 | $92,623 |
| 2017 | $1,563 | $121,623 | $29,000 | $92,623 |
| 2016 | $1,563 | $121,623 | $29,000 | $92,623 |
| 2014 | $1,611 | $129,415 | $29,000 | $100,415 |
Source: Public Records
Map
Nearby Homes
- 3556 Jetstream Dr
- 3555 Jetstream Dr
- 2911 Ridge Rd NW
- 4102 Huntsmoor Ln
- 2834 Lancaster Rd NW
- 4008 Huntsmoor Ln
- 3804 Falcon Ct
- 3801 Falcon Ct
- 3534 Wescott Dr NW
- 3803 Falcon Ct
- 3805 Falcon Ct
- 3513 Providence Ln NW
- 3807 Falcon Ct
- 3405 Airport Blvd NW
- 3402 Wescott Dr NW Unit B
- Olivia Plan at Jetstream Park
- Brandon Plan at Jetstream Park
- Rachel Plan at Jetstream Park
- Sanford Plan at Jetstream Park
- 3906 Falcon Ct
- 3712 Lear Ct NW
- 3714 Lear Ct NW
- 3719 Lear Ct NW
- 3721 Lear Ct NW
- 3721 Starship Ln NW
- 3729 Starship Ln NW
- 3715 Lear Ct NW
- 3725 Lear Ct NW
- 3713 Lear Ct NW
- 3731 Starship Ln NW
- 3719 Starship Ln NW
- 3702 Lear Ct NW
- 3726 Starship Ln NW
- 3730 Starship Ln NW
- 3711 Lear Ct NW
- 3724 Starship Ln NW
- 3733 Starship Ln NW
- 3722 Starship Ln NW Unit A & B
- 3608 Citation Ct NW
- 3734 Starship Ln NW