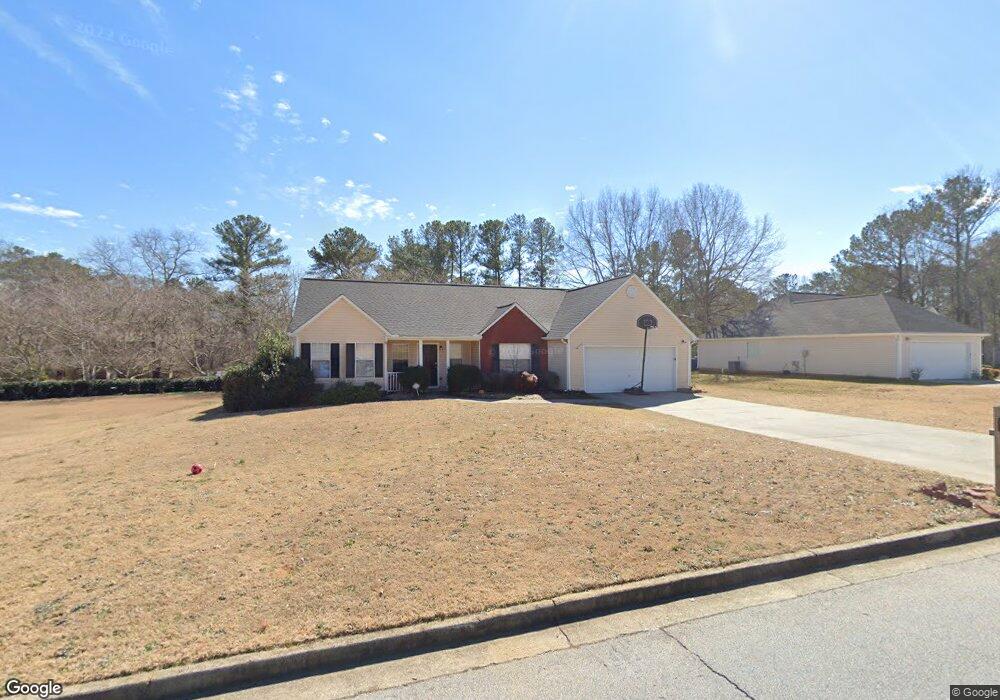
3710 Michaels Creek Way Loganville, GA 30052
Estimated Value: $301,000 - $310,184
3
Beds
2
Baths
1,520
Sq Ft
$202/Sq Ft
Est. Value
About This Home
This home is located at 3710 Michaels Creek Way, Loganville, GA 30052 and is currently estimated at $307,046, approximately $202 per square foot. 3710 Michaels Creek Way is a home located in Gwinnett County with nearby schools including Rosebud Elementary School, Grace Snell Middle School, and South Gwinnett High School.
Ownership History
Date
Name
Owned For
Owner Type
Purchase Details
Closed on
Sep 26, 2019
Sold by
Sfr Jv 1 Property Llc
Bought by
Sfr Jv 1 2019 1 Borrower Llc
Current Estimated Value
Purchase Details
Closed on
Aug 16, 2018
Sold by
Opendoor Property W3 Llc
Bought by
Sfr Jv 1 Property Llc
Purchase Details
Closed on
Jul 27, 2018
Sold by
Yancey Alan
Bought by
Opendoor Property W3 Llc
Purchase Details
Closed on
Mar 31, 2006
Sold by
Yancey Berle A
Bought by
Yancey Alan
Home Financials for this Owner
Home Financials are based on the most recent Mortgage that was taken out on this home.
Original Mortgage
$120,785
Interest Rate
6.25%
Mortgage Type
New Conventional
Purchase Details
Closed on
Mar 14, 2004
Sold by
Yancey Ethan E
Bought by
Yancey Berle E
Purchase Details
Closed on
Oct 15, 1999
Sold by
Meredian Homes
Bought by
Yancey Ethan E
Create a Home Valuation Report for This Property
The Home Valuation Report is an in-depth analysis detailing your home's value as well as a comparison with similar homes in the area
Home Values in the Area
Average Home Value in this Area
Purchase History
| Date | Buyer | Sale Price | Title Company |
|---|---|---|---|
| Sfr Jv 1 2019 1 Borrower Llc | -- | -- | |
| Sfr Jv 1 Property Llc | $152,500 | -- | |
| Opendoor Property W3 Llc | $149,500 | -- | |
| Yancey Alan | $140,000 | -- | |
| Yancey Berle E | -- | -- | |
| Yancey Ethan E | $108,600 | -- |
Source: Public Records
Mortgage History
| Date | Status | Borrower | Loan Amount |
|---|---|---|---|
| Previous Owner | Yancey Alan | $120,785 |
Source: Public Records
Tax History Compared to Growth
Tax History
| Year | Tax Paid | Tax Assessment Tax Assessment Total Assessment is a certain percentage of the fair market value that is determined by local assessors to be the total taxable value of land and additions on the property. | Land | Improvement |
|---|---|---|---|---|
| 2024 | $4,503 | $115,440 | $19,800 | $95,640 |
| 2023 | $4,503 | $123,600 | $27,080 | $96,520 |
| 2022 | $2,820 | $68,920 | $14,000 | $54,920 |
| 2021 | $2,844 | $68,920 | $14,000 | $54,920 |
| 2020 | $2,858 | $68,920 | $14,000 | $54,920 |
| 2019 | $2,478 | $61,000 | $12,800 | $48,200 |
| 2018 | $2,081 | $58,880 | $11,200 | $47,680 |
| 2016 | $1,943 | $51,520 | $9,600 | $41,920 |
| 2015 | $1,717 | $44,360 | $9,600 | $34,760 |
| 2014 | $1,725 | $44,360 | $9,600 | $34,760 |
Source: Public Records
Map
Nearby Homes
- 1490 Twin Manor Dr
- 1550 Twin Manor Dr
- 4181 Brindle Place
- 1743 Fawlocke Run
- 4201 Brindle Place
- 4161 Brindle Place
- 1763 Fawlocke Run
- 1375 Windance Lake Dr
- 1385 Windance Lake Dr Unit LOT 8
- 1385 Windance Lake Dr
- 1365 Windance Lake Dr
- 4066 Wild Orchid Ln
- 4171 Brindle Place
- 1714 Fawlocke Run
- 4190 Beaver Rd
- 4385 Foxberry Run
- 3720 Michaels Creek Way
- 4195 Janel Ln
- 4192 Alaina Ave
- 3730 Michaels Creek Way
- 1540 Virgil Moon Rd
- 3705 Michaels Creek Way
- 1550 Virgil Moon Rd Unit 2
- 1550 Virgil Moon Rd
- 0 Janel Ln Unit 7454607
- 0 Janel Ln Unit 8469000
- 0 Janel Ln Unit 8306554
- 0 Janel Ln Unit 8215097
- 0 Janel Ln
- 4190 Janel Ln
- 3745 Michaels Creek Way
- 3740 Michaels Creek Way
- 4182 Alaina Ave
- 4180 Janel Ln
- 4165 Janel Ln
- 4165 Janel Ln Unit 4165