Estimated Value: $1,611,000 - $1,868,000
4
Beds
4
Baths
2,313
Sq Ft
$758/Sq Ft
Est. Value
About This Home
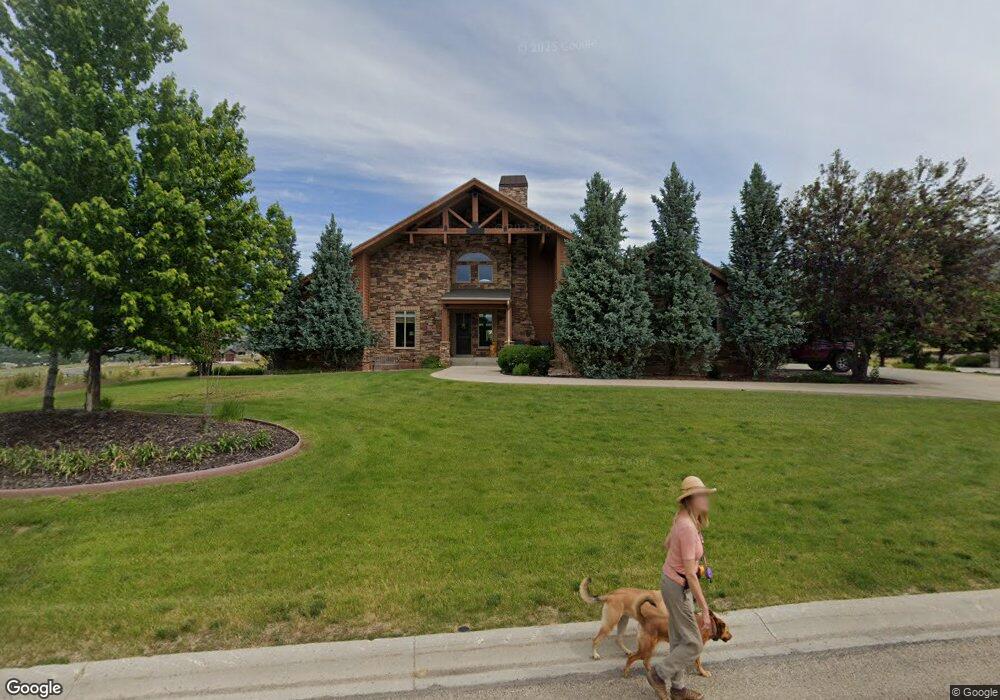
This home is located at 3710 N Foothill Ln Unit 9, Eden, UT 84310 and is currently estimated at $1,752,634, approximately $757 per square foot. 3710 N Foothill Ln Unit 9 is a home located in Weber County with nearby schools including Valley Elementary School, Snowcrest Junior High School, and Weber High School.
Ownership History
Date
Name
Owned For
Owner Type
Purchase Details
Closed on
Dec 1, 2022
Sold by
Ronald And Shelly Baty Family Trust
Bought by
Michaels David and Michaels Laura
Current Estimated Value
Home Financials for this Owner
Home Financials are based on the most recent Mortgage that was taken out on this home.
Original Mortgage
$680,000
Outstanding Balance
$659,595
Interest Rate
6.95%
Mortgage Type
New Conventional
Estimated Equity
$1,093,039
Purchase Details
Closed on
Jun 24, 2010
Sold by
Baty Ronald D and Baty Shelly A
Bought by
Baty Ronald D and Baty Shelly A
Home Financials for this Owner
Home Financials are based on the most recent Mortgage that was taken out on this home.
Original Mortgage
$395,050
Interest Rate
4.91%
Mortgage Type
New Conventional
Purchase Details
Closed on
Jun 23, 2009
Sold by
Baty Ronald D and Baty Shelly A
Bought by
Baty Ronald D and Baty Shelly A
Purchase Details
Closed on
Oct 29, 2004
Sold by
Opheikens Properties Lc
Bought by
Baty Ronald D and Baty Shelly A
Create a Home Valuation Report for This Property
The Home Valuation Report is an in-depth analysis detailing your home's value as well as a comparison with similar homes in the area
Home Values in the Area
Average Home Value in this Area
Purchase History
| Date | Buyer | Sale Price | Title Company |
|---|---|---|---|
| Michaels David | -- | -- | |
| Baty Ronald D | -- | Bonneville Superior Title Co | |
| Baty Ronald D | -- | Bonneville Superior Title Co | |
| Baty Ronald D | -- | None Available | |
| Baty Ronald D | -- | Bonneville Title Company Cle |
Source: Public Records
Mortgage History
| Date | Status | Borrower | Loan Amount |
|---|---|---|---|
| Open | Michaels David | $680,000 | |
| Previous Owner | Baty Ronald D | $395,050 |
Source: Public Records
Tax History Compared to Growth
Tax History
| Year | Tax Paid | Tax Assessment Tax Assessment Total Assessment is a certain percentage of the fair market value that is determined by local assessors to be the total taxable value of land and additions on the property. | Land | Improvement |
|---|---|---|---|---|
| 2025 | $9,019 | $1,695,850 | $309,168 | $1,386,682 |
| 2024 | $8,234 | $868,449 | $168,748 | $699,701 |
| 2023 | $8,082 | $841,347 | $156,181 | $685,166 |
| 2022 | $7,235 | $767,042 | $155,910 | $611,132 |
| 2021 | $5,034 | $899,000 | $192,144 | $706,856 |
| 2020 | $4,423 | $725,000 | $141,950 | $583,050 |
| 2019 | $4,125 | $647,016 | $101,660 | $545,356 |
| 2018 | $4,054 | $609,923 | $96,239 | $513,684 |
| 2017 | $4,086 | $599,129 | $96,239 | $502,890 |
| 2016 | $3,854 | $306,652 | $50,228 | $256,424 |
| 2015 | $2,891 | $227,150 | $39,161 | $187,989 |
| 2014 | $2,961 | $227,150 | $33,621 | $193,529 |
Source: Public Records
Map
Nearby Homes
- 3710 N Foothill Ln
- 3700 N Foothill Ln
- 3858 E Eagle Ct
- 3669 N Foothill Ln
- 3727 N Patio Springs Cir
- 3896 N Eagle Ridge Dr E
- 3651 N Eagle Ridge Dr E
- 4504 E 3450 N
- 3425 Fuller Dr
- 3674 N Willow Brooke Ln
- 3780 N Willow Brooke Ln
- 3503 N Willow Creek Ln
- 4293 Sunrise Dr
- 3510 N Willow Creek Ln Unit 9
- 3880 N 4975 E Unit C207
- 3615 N Wolf Lodge Dr Unit 211
- 3615 N Wolf Lodge Dr Unit 402
- 3615 N Wolf Lodge Dr Unit 103
- 3615 N Wolf Dr Unit 309
- 3615 N Wolf Lodge Dr Unit 805
- 3720 N Foothill Ln
- 3720 N Foothill Ln E Unit 8
- 3711 N Foothill Ln
- 3711 N Foothill Ln Unit 6
- 3699 N Foothill Ln
- 3699 N Foothill Ln Unit 5
- 3721 N Foothill Ln
- 3778 N Eagle Ridge Dr Unit 27
- 3694 N Foothill Ln
- 3749 Eagleridge Dr
- 3868 Eagle Ct Unit 31
- 3858 E Eagle Ct Unit 30
- 3705 N Eagleridge Dr E
- 3696 N Eagle Ridge Dr Unit 26
- 3852 E Eagle Ct Unit 29
- 3682 N Foothill Ln
- 3866 N Eagle Ct E Unit 31
- 3669 N Foothill Ln Unit 4
- 3672 N Foothill Ln Unit 13
- 3672 N Foothill Ln