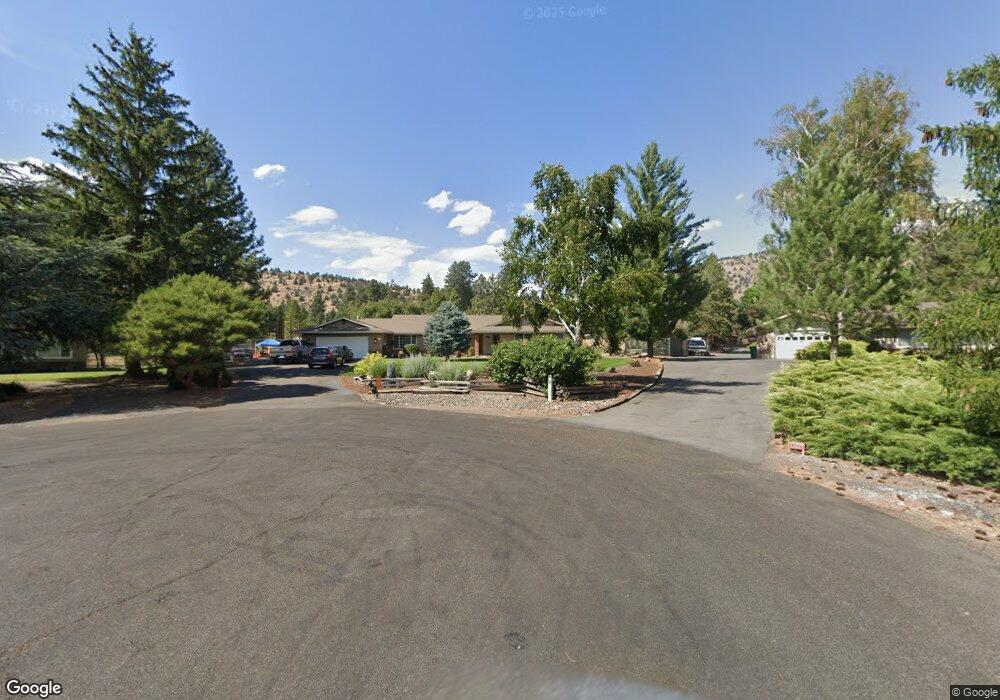
3710 Schooler Ct Klamath Falls, OR 97603
Estimated Value: $557,571 - $568,000
4
Beds
3
Baths
2,603
Sq Ft
$216/Sq Ft
Est. Value
About This Home
This home is located at 3710 Schooler Ct, Klamath Falls, OR 97603 and is currently estimated at $562,786, approximately $216 per square foot. 3710 Schooler Ct is a home located in Klamath County with nearby schools including Ferguson Elementary School, Henley Middle School, and Henley High School.
Ownership History
Date
Name
Owned For
Owner Type
Purchase Details
Closed on
Sep 16, 2020
Sold by
Ugf41nv Llc
Bought by
Davis Stuart William and Davis Angela Lou
Current Estimated Value
Home Financials for this Owner
Home Financials are based on the most recent Mortgage that was taken out on this home.
Original Mortgage
$235,700
Outstanding Balance
$168,199
Interest Rate
2.9%
Mortgage Type
New Conventional
Estimated Equity
$394,587
Purchase Details
Closed on
Oct 9, 2018
Sold by
Walchak Dean and Walchak Tamara
Bought by
Ugf4inv Llc
Purchase Details
Closed on
Jan 14, 2006
Sold by
Walchak Dean
Bought by
Walchak Dean and Walchak Tamara
Home Financials for this Owner
Home Financials are based on the most recent Mortgage that was taken out on this home.
Original Mortgage
$207,125
Interest Rate
8.35%
Mortgage Type
Adjustable Rate Mortgage/ARM
Create a Home Valuation Report for This Property
The Home Valuation Report is an in-depth analysis detailing your home's value as well as a comparison with similar homes in the area
Home Values in the Area
Average Home Value in this Area
Purchase History
| Date | Buyer | Sale Price | Title Company |
|---|---|---|---|
| Davis Stuart William | $335,700 | Amerititle | |
| Ugf4inv Llc | $162,927 | None Available | |
| Walchak Dean | -- | None Available |
Source: Public Records
Mortgage History
| Date | Status | Borrower | Loan Amount |
|---|---|---|---|
| Open | Davis Stuart William | $235,700 | |
| Previous Owner | Walchak Dean | $207,125 |
Source: Public Records
Tax History Compared to Growth
Tax History
| Year | Tax Paid | Tax Assessment Tax Assessment Total Assessment is a certain percentage of the fair market value that is determined by local assessors to be the total taxable value of land and additions on the property. | Land | Improvement |
|---|---|---|---|---|
| 2024 | $3,607 | $322,290 | -- | -- |
| 2023 | $3,468 | $322,290 | $0 | $0 |
| 2022 | $3,376 | $303,800 | $0 | $0 |
| 2021 | $3,267 | $294,960 | $0 | $0 |
| 2020 | $3,166 | $286,370 | $0 | $0 |
| 2019 | $3,087 | $278,030 | $0 | $0 |
| 2018 | $2,997 | $269,940 | $0 | $0 |
| 2017 | $2,920 | $262,080 | $0 | $0 |
| 2016 | $2,841 | $254,450 | $0 | $0 |
| 2015 | $2,764 | $247,040 | $0 | $0 |
| 2014 | $2,637 | $239,850 | $0 | $0 |
| 2013 | -- | $231,730 | $0 | $0 |
Source: Public Records
Map
Nearby Homes
- 3213 Country Ln
- 6 Herr Ct
- 12140 Clovis Dr
- 3418 Shield Crest Dr Unit 1A
- 3414 Shield Crest Dr
- 3120 Shield Crest Dr
- 9221 St Andrews Cir
- 12341 Lupine Ln
- 9026 Arant Rd
- 0 Vale Rd Unit Lot 601 220206104
- 0 Vale Rd Unit Lot 604 220206106
- 0 Vale (Parcel 2 of 2 53 Acres) Rd Unit 220183710
- 8333 Oregon 140
- 0 Herr Unit 220195238
- 4975 Chilly Valley Ln
- 0 Reeder Rd
- 7649 Booth Rd
- 0 Crystal Springs Rd Unit 220211534
- 0 Crystal Springs Rd Unit P600638
- 0 Crystal Springs Rd Unit NKA 0 220205539
- 3712 Schooler Ct
- 3715 Schooler Ct
- 3738 Schooler Ct
- 3741 Schooler Ct
- 1645 Pine Grove Rd
- 1543 Pine Grove Rd
- 1801 Pine Grove Rd
- 3635 Seutter Place
- 3703 Seutter Place
- 1371 Pine Grove Rd
- 3770 Schooler Ct
- 1151 Pine Grove Rd
- 11011 Miracle Dr
- 1147 Pine Grove Rd
- 1710 Pine Grove Rd
- 1650 Pine Grove Rd
- 3605 Seutter Place
- 3710 Seutter Place
- 3626 Seutter Place
- 1522 Pine Grove Rd