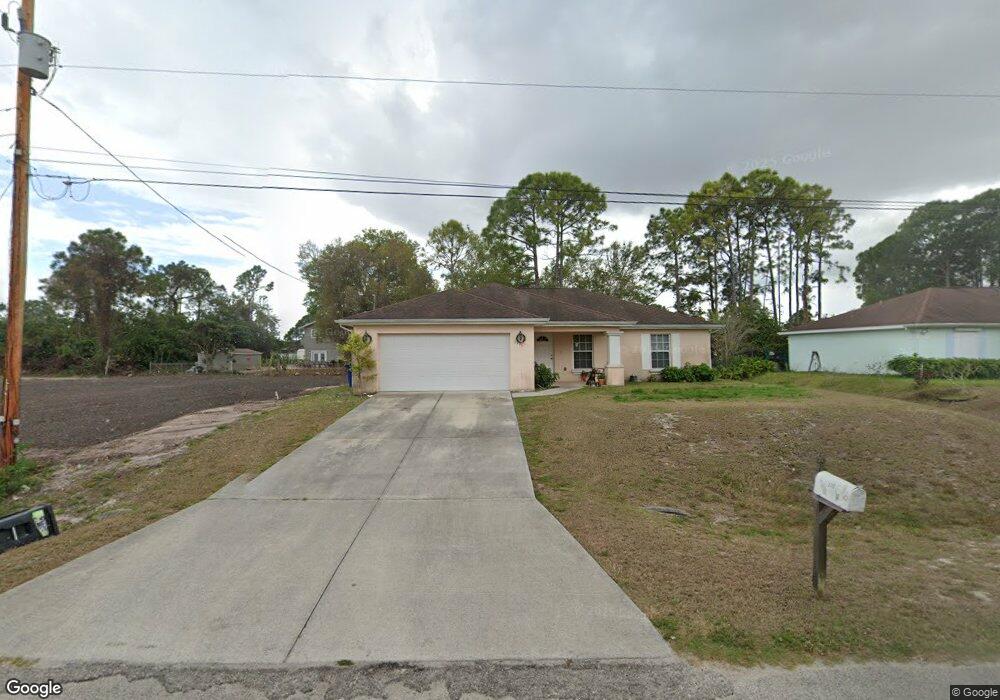
3711 4th St W Lehigh Acres, FL 33971
Sunshine NeighborhoodEstimated Value: $273,678 - $362,000
3
Beds
2
Baths
1,618
Sq Ft
$192/Sq Ft
Est. Value
About This Home
This home is located at 3711 4th St W, Lehigh Acres, FL 33971 and is currently estimated at $309,920, approximately $191 per square foot. 3711 4th St W is a home located in Lee County with nearby schools including Lehigh Elementary School, Gateway Elementary School, and Tice Elementary School.
Ownership History
Date
Name
Owned For
Owner Type
Purchase Details
Closed on
Jul 3, 2008
Sold by
K Hovnanian First Homes Llc
Bought by
Preston Cynthia
Current Estimated Value
Home Financials for this Owner
Home Financials are based on the most recent Mortgage that was taken out on this home.
Original Mortgage
$135,877
Outstanding Balance
$87,703
Interest Rate
6.08%
Mortgage Type
FHA
Estimated Equity
$222,217
Purchase Details
Closed on
Apr 14, 2008
Sold by
Aquino Aylec Morell
Bought by
K Hovnanian First Homes Llc
Purchase Details
Closed on
Jun 28, 2006
Sold by
K Hovnanian First Homes Llc
Bought by
Aquino Aylec Morell
Home Financials for this Owner
Home Financials are based on the most recent Mortgage that was taken out on this home.
Original Mortgage
$261,000
Interest Rate
6.55%
Mortgage Type
Construction
Create a Home Valuation Report for This Property
The Home Valuation Report is an in-depth analysis detailing your home's value as well as a comparison with similar homes in the area
Home Values in the Area
Average Home Value in this Area
Purchase History
| Date | Buyer | Sale Price | Title Company |
|---|---|---|---|
| Preston Cynthia | $138,100 | Southwest Cmnty Title Inc | |
| K Hovnanian First Homes Llc | $37,000 | Attorney | |
| Aquino Aylec Morell | $97,900 | First Home Title Llc |
Source: Public Records
Mortgage History
| Date | Status | Borrower | Loan Amount |
|---|---|---|---|
| Open | Preston Cynthia | $135,877 | |
| Previous Owner | Aquino Aylec Morell | $261,000 |
Source: Public Records
Tax History Compared to Growth
Tax History
| Year | Tax Paid | Tax Assessment Tax Assessment Total Assessment is a certain percentage of the fair market value that is determined by local assessors to be the total taxable value of land and additions on the property. | Land | Improvement |
|---|---|---|---|---|
| 2025 | $1,094 | $61,514 | -- | -- |
| 2024 | $1,094 | $59,780 | -- | -- |
| 2023 | $1,094 | $58,039 | $0 | $0 |
| 2022 | $1,011 | $56,349 | $0 | $0 |
| 2021 | $938 | $157,655 | $7,300 | $150,355 |
| 2020 | $931 | $53,953 | $0 | $0 |
| 2019 | $964 | $52,740 | $0 | $0 |
| 2018 | $939 | $51,757 | $0 | $0 |
| 2017 | $901 | $50,692 | $0 | $0 |
| 2016 | $871 | $101,384 | $5,000 | $96,384 |
| 2015 | $860 | $90,098 | $4,500 | $85,598 |
| 2014 | -- | $75,803 | $2,715 | $73,088 |
| 2013 | -- | $64,607 | $2,700 | $61,907 |
Source: Public Records
Map
Nearby Homes
- 3701 2nd St W
- 1505 Olive Ave S
- 3717 6th St W
- 3001 Unice Ave S
- 59 Xelda Ave S
- 3512 2nd St W
- 3510 2nd St W
- 3714 2nd St SW
- 3506 3rd St W
- 3713 2nd St SW
- 4208 Lee Blvd
- 3803 1st St SW
- 3702 3rd St SW
- 55 Tena Ave S
- 900 Sunniland Blvd
- 804 Yvonne Ave N
- 101 Sara Ave N
- 3914 4th St W
- 3708 9th St W
- 3802 3rd St SW