Estimated Value: $207,701 - $259,000
3
Beds
1
Bath
1,428
Sq Ft
$166/Sq Ft
Est. Value
About This Home
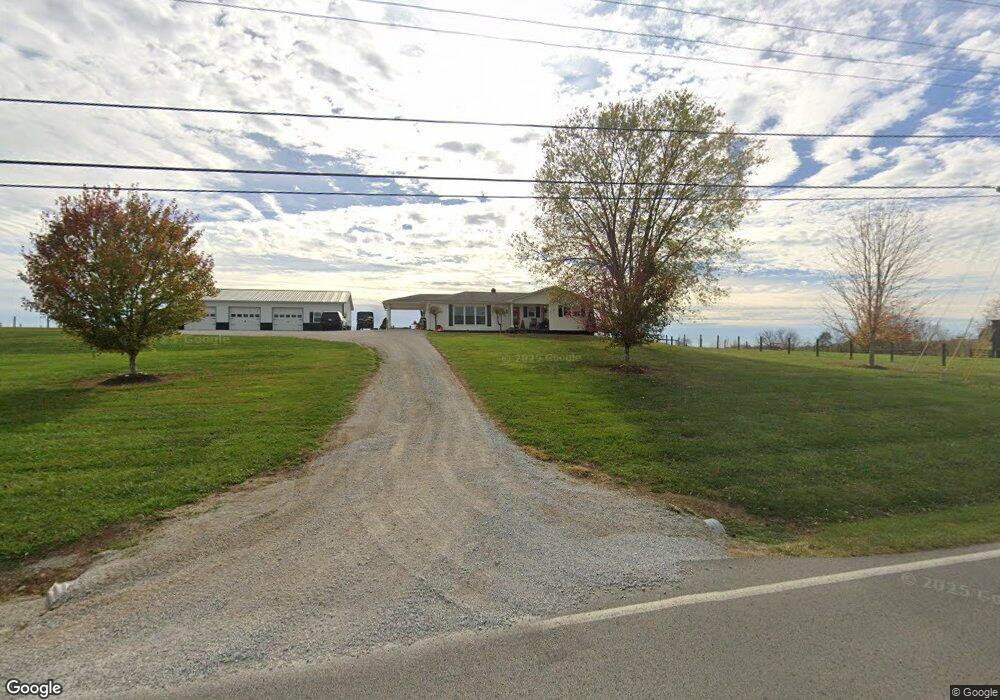
This home is located at 3711 Ewing Rd, Ewing, KY 41039 and is currently estimated at $237,675, approximately $166 per square foot. 3711 Ewing Rd is a home located in Fleming County with nearby schools including Fleming County High School.
Ownership History
Date
Name
Owned For
Owner Type
Purchase Details
Closed on
May 12, 2015
Sold by
Wagner Amanda S
Bought by
Wagner Jared B
Current Estimated Value
Purchase Details
Closed on
Mar 16, 2009
Sold by
Hughes Gregory B and Hughes
Bought by
Wagner Jared B and Wagner
Home Financials for this Owner
Home Financials are based on the most recent Mortgage that was taken out on this home.
Original Mortgage
$125,800
Outstanding Balance
$79,648
Interest Rate
5.13%
Mortgage Type
Purchase Money Mortgage
Estimated Equity
$158,027
Create a Home Valuation Report for This Property
The Home Valuation Report is an in-depth analysis detailing your home's value as well as a comparison with similar homes in the area
Purchase History
| Date | Buyer | Sale Price | Title Company |
|---|---|---|---|
| Wagner Jared B | -- | None Available | |
| Wagner Jared B | $120,000 | -- |
Source: Public Records
Mortgage History
| Date | Status | Borrower | Loan Amount |
|---|---|---|---|
| Open | Wagner Jared B | $125,800 |
Source: Public Records
Tax History
| Year | Tax Paid | Tax Assessment Tax Assessment Total Assessment is a certain percentage of the fair market value that is determined by local assessors to be the total taxable value of land and additions on the property. | Land | Improvement |
|---|---|---|---|---|
| 2025 | $1,505 | $155,000 | $50,000 | $105,000 |
| 2024 | $1,525 | $155,000 | $50,000 | $105,000 |
| 2023 | $1,553 | $155,000 | $50,000 | $105,000 |
| 2022 | $1,550 | $155,000 | $50,000 | $105,000 |
| 2021 | $1,595 | $155,000 | $50,000 | $105,000 |
| 2020 | $1,597 | $155,000 | $50,000 | $105,000 |
| 2019 | $1,273 | $125,000 | $50,000 | $75,000 |
| 2018 | $1,212 | $125,000 | $50,000 | $75,000 |
| 2017 | $1,161 | $125,000 | $50,000 | $75,000 |
| 2016 | $1,158 | $120,000 | $50,000 | $70,000 |
| 2015 | $1,151 | $120,000 | $50,000 | $70,000 |
| 2012 | $1,084 | $120,000 | $50,000 | $70,000 |
Source: Public Records
Map
Nearby Homes
- 3162 Ewing Rd
- 2890 Elizaville Rd
- 2524 U S 68
- 433 Lake View Rd
- 2997 Us 68
- 342 Lake View Rd
- 3389 Buchanan Creek Rd
- Pleasant Valley
- 0 Abners Mill Rd
- 5198 Elizaville Rd
- 2850 Tea Run Rd
- 85 Blue Licks
- 0 Goose Creek Rd Unit Lot WP001 21781534
- 0 Goose Creek Rd
- 5755 U S 68
- A Kentucky 57
- 0 Hilltop Rd
- 7370 Energy Rd
- 355 Clover Hill Rd
- 7295 Energy Rd
Your Personal Tour Guide
Ask me questions while you tour the home.