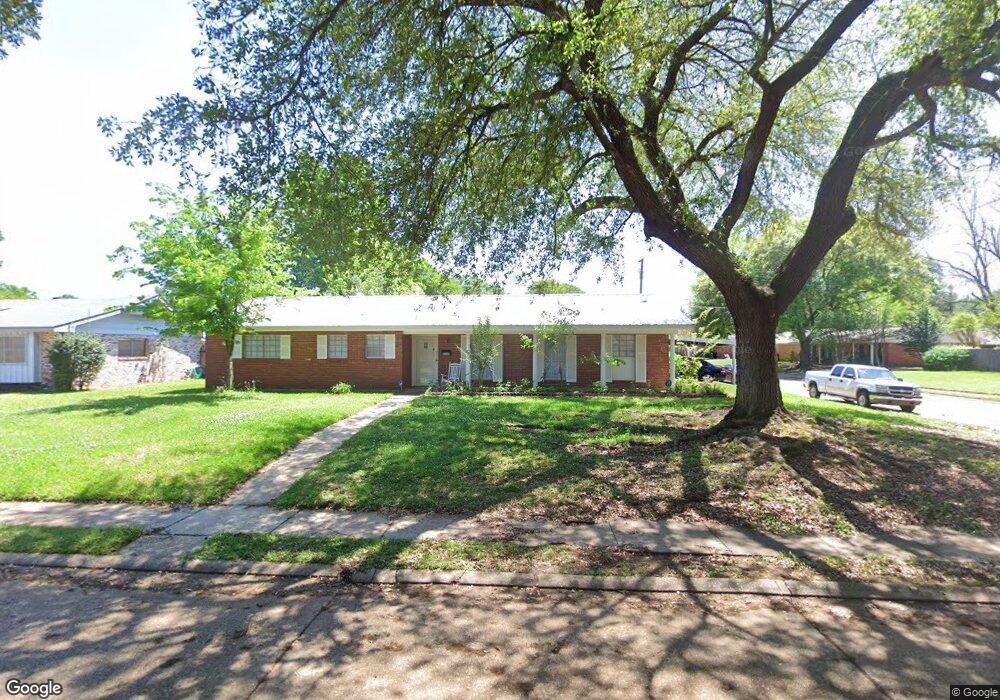
3711 Gingerbread Rd Alexandria, LA 71303
Estimated Value: $178,000 - $218,819
4
Beds
2
Baths
2,409
Sq Ft
$81/Sq Ft
Est. Value
About This Home
This home is located at 3711 Gingerbread Rd, Alexandria, LA 71303 and is currently estimated at $195,455, approximately $81 per square foot. 3711 Gingerbread Rd is a home located in Rapides Parish with nearby schools including J.B. Nachman Elementary School, Alexandria Middle Magnet School, and Bolton High School.
Ownership History
Date
Name
Owned For
Owner Type
Purchase Details
Closed on
May 10, 2025
Sold by
Taylor Vaifanua Tamara
Bought by
Johnson Devante Damon
Current Estimated Value
Purchase Details
Closed on
Oct 8, 2024
Sold by
Beachbound Llc
Bought by
Johnson Devante Damon and Taylor Vaifanua Tamara
Home Financials for this Owner
Home Financials are based on the most recent Mortgage that was taken out on this home.
Original Mortgage
$189,504
Interest Rate
6.6%
Mortgage Type
FHA
Purchase Details
Closed on
May 6, 2024
Sold by
Mccarty Kimbrel Ann and Bass Kaeryn Elizabeth
Bought by
Beachbound Llc
Home Financials for this Owner
Home Financials are based on the most recent Mortgage that was taken out on this home.
Original Mortgage
$116,947
Interest Rate
6.87%
Mortgage Type
Credit Line Revolving
Purchase Details
Closed on
Aug 7, 2020
Sold by
Hugh Mccarty
Bought by
Bare Investments
Create a Home Valuation Report for This Property
The Home Valuation Report is an in-depth analysis detailing your home's value as well as a comparison with similar homes in the area
Home Values in the Area
Average Home Value in this Area
Purchase History
| Date | Buyer | Sale Price | Title Company |
|---|---|---|---|
| Johnson Devante Damon | $18,500 | None Listed On Document | |
| Johnson Devante Damon | $193,000 | None Listed On Document | |
| Beachbound Llc | $115,000 | None Listed On Document | |
| Bare Investments | $260 | None Available |
Source: Public Records
Mortgage History
| Date | Status | Borrower | Loan Amount |
|---|---|---|---|
| Previous Owner | Johnson Devante Damon | $189,504 | |
| Previous Owner | Beachbound Llc | $116,947 |
Source: Public Records
Tax History Compared to Growth
Tax History
| Year | Tax Paid | Tax Assessment Tax Assessment Total Assessment is a certain percentage of the fair market value that is determined by local assessors to be the total taxable value of land and additions on the property. | Land | Improvement |
|---|---|---|---|---|
| 2024 | $1,226 | $11,500 | $1,300 | $10,200 |
| 2023 | $0 | $7,326 | $1,152 | $6,174 |
| 2022 | $980 | $7,326 | $1,152 | $6,174 |
| 2021 | $858 | $7,326 | $1,152 | $6,174 |
| 2020 | $858 | $7,326 | $1,152 | $6,174 |
| 2019 | $678 | $7,326 | $1,152 | $6,174 |
| 2018 | $0 | $7,326 | $1,152 | $6,174 |
| 2017 | $0 | $7,326 | $1,152 | $6,174 |
| 2016 | $928 | $7,326 | $1,152 | $6,174 |
| 2015 | $925 | $7,326 | $1,152 | $6,174 |
| 2014 | $928 | $7,326 | $1,152 | $6,174 |
| 2013 | $893 | $7,326 | $1,152 | $6,174 |
Source: Public Records
Map
Nearby Homes
- 3808 Gingerbread Rd
- 58 Heyman Ln
- 0 Heyman Ln
- 1116 Southampton Dr
- 507 Ridgewood Blvd
- 1207 Heyman Ln
- 215 Heyman Ln
- 4003 Leon Dr
- 4011 Leon Dr
- 4103 Whitefield Blvd
- 203 Tanglewood Dr
- 207 Heyman Ln
- 3123 Nelson St
- 4014 Wellington Blvd
- 3026 Marye St
- 4400 Charleston Cir Unit 5
- 368 Windermere Blvd
- 4108 Coliseum Unit TRACT A
- 380 Windermere Blvd
- 7309 U S 165
- 3707 Gingerbread Rd
- 907 Candy Ln
- 3803 Gingerbread Rd
- 3703 Gingerbread Rd
- 3712 Gingerbread Rd
- 1003 Candy Ln
- 3708 Gingerbread Rd
- 908 Candy Ln
- 1008 Gretel Ct
- 3804 Gingerbread Rd
- 3704 Gingerbread Rd
- 1004 Candy Ln
- 3615 Gingerbread Rd
- 3807 Gingerbread Rd
- 1007 Candy Ln
- 1004 Gretel Ct
- 1012 Gretel Ct
- 1008 Candy Ln
- 3616 Gingerbread Rd
- 3611 Gingerbread Rd