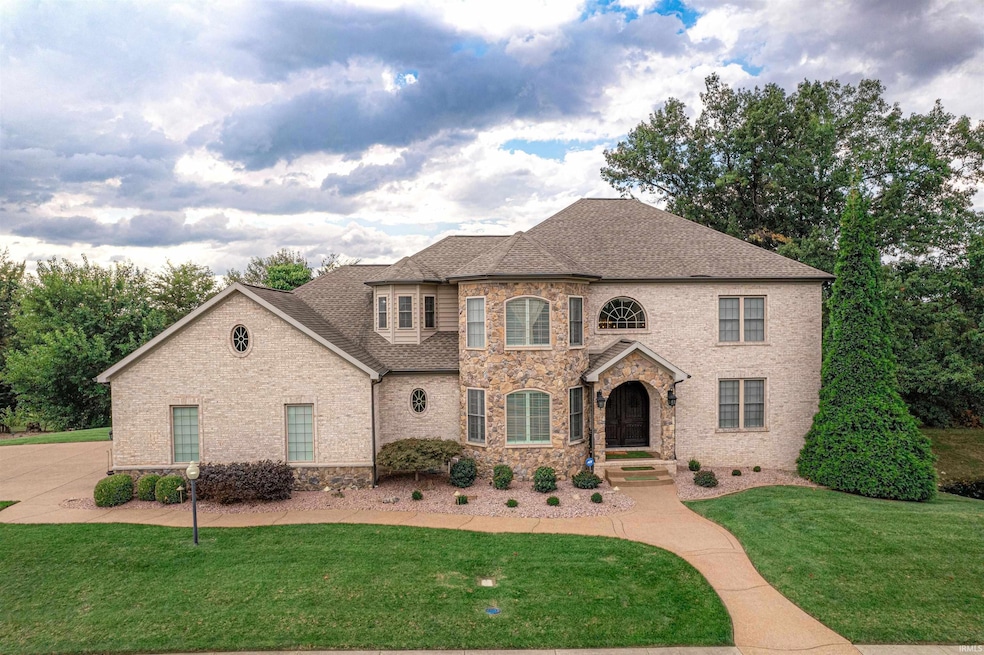


3711 Joseph Ct Newburgh, IN 47630
Estimated payment $5,545/month
Highlights
- 1.1 Acre Lot
- 1 Fireplace
- Walk-In Pantry
- John H. Castle Elementary School Rated A-
- Utility Room in Garage
- 3 Car Attached Garage
About This Home
This stately executive-style home blends spacious living, high-end finishes, and thoughtful updates throughout. Offering over 4,400 square feet above grade plus an additional 2,400+ square feet in the walkout basement, it provides exceptional room for both relaxation and entertaining.Perched on a 1.1-acre lot with peaceful lake views and access, the property delivers a sense of privacy and tranquility rarely found in such a convenient location.A three-car garage provides ample space for vehicles, storage, or hobbies, complementing the home’s generous layout.The walkout basement features a full wet bar, recreation area, office or home gym, bedroom, and full bath — all opening to a patio overlooking the lake.Upstairs, you’ll find three spacious bedrooms, a bonus room, and a serene primary suite with generous closet space. The sunroom off the kitchen, equipped with a gas range, is perfect for year-round enjoyment. Step from the sunroom or family room onto an expansive Trex deck — ideal for outdoor dining or simply taking in the view.A soaring, beamed entryway welcomes you into the main level, which also includes a guest suite with full ensuite bath, a formal living room, a comfortable family room, and an open-concept kitchen with casual dining area.Located near the Newburgh commercial corridor and within the Castle School District, this impressive home combines luxury, space, and convenience in one of the area’s most desirable settings.
Home Details
Home Type
- Single Family
Est. Annual Taxes
- $8,149
Year Built
- Built in 2012
Lot Details
- 1.1 Acre Lot
- Lot Dimensions are 120x120
HOA Fees
- $15 Monthly HOA Fees
Parking
- 3 Car Attached Garage
- Garage Door Opener
Home Design
- Brick Exterior Construction
Interior Spaces
- 2-Story Property
- Bar
- 1 Fireplace
- Utility Room in Garage
Kitchen
- Walk-In Pantry
- Kitchen Island
Bedrooms and Bathrooms
- 5 Bedrooms
- Walk-In Closet
- Double Vanity
Finished Basement
- 1 Bathroom in Basement
- 1 Bedroom in Basement
Outdoor Features
- Covered Deck
Schools
- Castle Elementary School
- Castle North Middle School
- Castle High School
Utilities
- Central Air
- ENERGY STAR Qualified Water Heater
Community Details
- Engelbrecht Place Subdivision
Listing and Financial Details
- Assessor Parcel Number 87-12-23-312-076.000-019
Map
Home Values in the Area
Average Home Value in this Area
Tax History
We collect this data history from publicly available records. To have your information removed, we recommend requesting removal directly through your county’s website.
| Year | Tax Paid | Tax Assessment Tax Assessment Total Assessment is a certain percentage of the fair market value that is determined by local assessors to be the total taxable value of land and additions on the property. | Land | Improvement |
|---|---|---|---|---|
| 2025 | $5,913 | $781,300 | $68,600 | $712,700 |
| 2024 | $8,176 | $912,800 | $85,300 | $827,500 |
| 2023 | $7,160 | $819,200 | $85,300 | $733,900 |
| 2022 | $7,394 | $803,200 | $85,300 | $717,900 |
| 2021 | $6,641 | $689,400 | $103,400 | $586,000 |
| 2020 | $6,261 | $638,300 | $94,900 | $543,400 |
| 2019 | $6,366 | $644,100 | $94,900 | $549,200 |
| 2018 | $6,104 | $634,600 | $94,900 | $539,700 |
| 2017 | $8,492 | $607,300 | $94,900 | $512,400 |
| 2016 | $5,152 | $548,600 | $94,900 | $453,700 |
| 2014 | $4,435 | $493,800 | $43,100 | $450,700 |
| 2013 | $3,889 | $447,700 | $43,000 | $404,700 |
Property History
We collect this data history from publicly available records. To have your information removed, we recommend requesting removal directly through your county’s website.
| Date | Event | Price | List to Sale | Price per Sq Ft |
|---|---|---|---|---|
| 03/16/2026 03/16/26 | Price Changed | $899,000 | -10.1% | $135 / Sq Ft |
| 10/27/2025 10/27/25 | For Sale | $999,800 | -- | $150 / Sq Ft |
Purchase History
We collect this data history from publicly available records. To have your information removed, we recommend requesting removal directly through your county’s website.
| Date | Type | Sale Price | Title Company |
|---|---|---|---|
| Warranty Deed | -- | Bosse Law Office Pc | |
| Warranty Deed | -- | None Available |
Source: Indiana Regional MLS
MLS Number: 202540564
APN: 87-12-23-312-076.000-019
Disclaimer: Certain information contained herein is derived from information provided by parties other than Homes.com. All information provided is deemed reliable, but is not guaranteed to be accurate and should be independently verified.
![]() Based on information submitted to the MLS GRID. All data is obtained from various sources and may not have been verified by broker or MLS GRID. Supplied Open House Information is subject to change without notice. All information should be independently reviewed and verified for accuracy. Properties may or may not be listed by the office/agent presenting the information. Some IDX listings have been excluded from this website. IDX information is provided exclusively for personal, non-commercial use, and may not be used for any purpose other than to identify prospective properties consumers may be interested in purchasing. Information is deemed reliable but not guaranteed.
Based on information submitted to the MLS GRID. All data is obtained from various sources and may not have been verified by broker or MLS GRID. Supplied Open House Information is subject to change without notice. All information should be independently reviewed and verified for accuracy. Properties may or may not be listed by the office/agent presenting the information. Some IDX listings have been excluded from this website. IDX information is provided exclusively for personal, non-commercial use, and may not be used for any purpose other than to identify prospective properties consumers may be interested in purchasing. Information is deemed reliable but not guaranteed.
Based on information submitted to the MLS GRID
- 3127 Dowgate Dr
- 3477 Brookfield Dr
- 3444 Eastbrooke Ct
- 7688 Vann Rd
- 4766 Indiana 261
- 3599 Crossgate Ct
- 3782 High Pointe Ln
- 7699 Hermitage Ct
- 3512 Udhe Ct
- 3466 Pine Ridge Dr
- 3411 Pine Ridge Dr
- 8459 Bell Crossing Dr
- 7966 Lake Terrace Ct
- 3288 Westhampton Dr
- 3539 Sand Dr
- 8511 Pebble Creek Dr
- 8523 Pebble Creek Dr
- 3535 Montgomery Ct
- 3569 Sand Dr
- 8344 N Birch Dr
- 3796 High Pointe Ln
- 114 Olde Newburgh Dr
- 107 Olde Newburgh Dr
- 4199 Old State Rte 261 Unit 4199 Old State Rte 261
- 8722 Messiah Dr
- 4333 Bell Rd
- 8001 Alexandra Ln
- 8582 Lincoln Ave
- 8584 Lincoln Ave
- 8611 Meadowood Dr
- 5041 E Sherwood Dr
- 3036 White Oak Trail
- 5200 E Timberwood Dr
- 3042 White Oak Trail
- 3018 White Oak Trail
- 3000 White Oak Trail
- 5265 Canyon Cir
- 9899 Warrick Trail
- 7872 Sandalwood Dr
- 7778 Sandalwood Dr

Ask me questions while you tour the home.