Estimated Value: $217,000 - $224,000
3
Beds
2
Baths
1,431
Sq Ft
$154/Sq Ft
Est. Value
About This Home
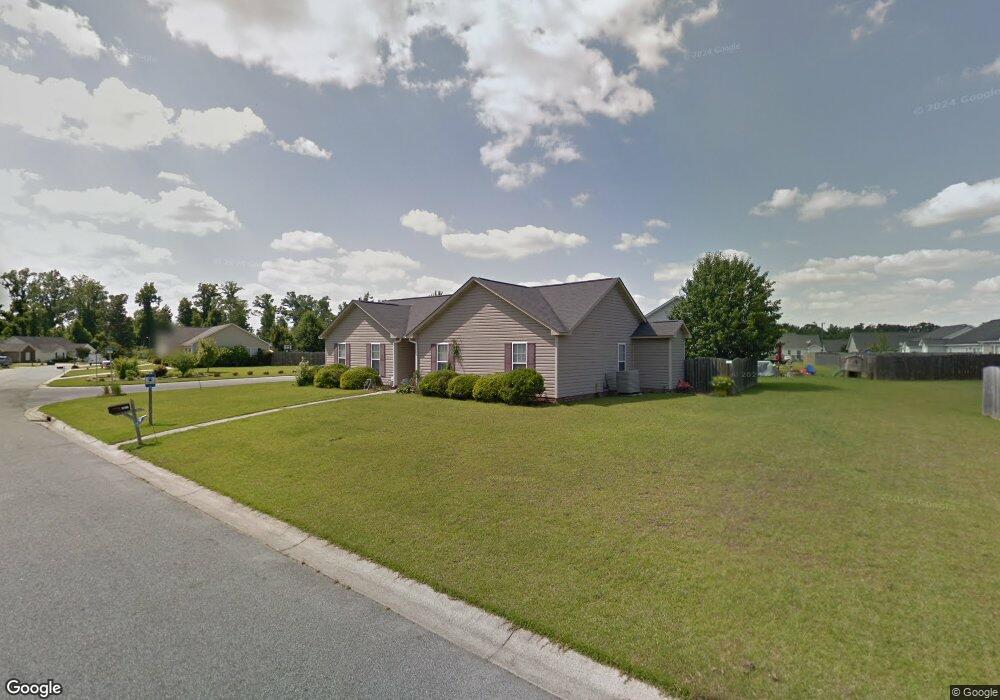
This home is located at 3711 Vista Ct, Ayden, NC 28513 and is currently estimated at $220,150, approximately $153 per square foot. 3711 Vista Ct is a home located in Pitt County with nearby schools including Ayden Elementary School, Ayden Middle School, and Ayden-Grifton High School.
Ownership History
Date
Name
Owned For
Owner Type
Purchase Details
Closed on
May 19, 2022
Sold by
Shaniqua Andrews
Bought by
Gaudet Nathan J
Current Estimated Value
Home Financials for this Owner
Home Financials are based on the most recent Mortgage that was taken out on this home.
Original Mortgage
$179,500
Outstanding Balance
$170,521
Interest Rate
5.25%
Mortgage Type
New Conventional
Estimated Equity
$49,629
Purchase Details
Closed on
Mar 17, 2020
Sold by
U S Bank National Association
Bought by
Andrews Shaniqua
Home Financials for this Owner
Home Financials are based on the most recent Mortgage that was taken out on this home.
Original Mortgage
$121,900
Interest Rate
4.37%
Mortgage Type
New Conventional
Purchase Details
Closed on
Jul 8, 2019
Sold by
Scales Tonya Y and Scales Bernard E
Bought by
Us Bank Na
Create a Home Valuation Report for This Property
The Home Valuation Report is an in-depth analysis detailing your home's value as well as a comparison with similar homes in the area
Home Values in the Area
Average Home Value in this Area
Purchase History
| Date | Buyer | Sale Price | Title Company |
|---|---|---|---|
| Gaudet Nathan J | $193,000 | None Listed On Document | |
| Andrews Shaniqua | -- | None Available | |
| Us Bank Na | $98,830 | -- |
Source: Public Records
Mortgage History
| Date | Status | Borrower | Loan Amount |
|---|---|---|---|
| Open | Gaudet Nathan J | $179,500 | |
| Previous Owner | Andrews Shaniqua | $121,900 |
Source: Public Records
Tax History
| Year | Tax Paid | Tax Assessment Tax Assessment Total Assessment is a certain percentage of the fair market value that is determined by local assessors to be the total taxable value of land and additions on the property. | Land | Improvement |
|---|---|---|---|---|
| 2025 | $2,078 | $165,903 | $28,000 | $137,903 |
| 2024 | $2,066 | $165,903 | $28,000 | $137,903 |
| 2023 | $1,724 | $125,320 | $19,000 | $106,320 |
| 2022 | $1,729 | $125,320 | $19,000 | $106,320 |
| 2021 | $1,724 | $125,320 | $19,000 | $106,320 |
| 2020 | $1,730 | $125,320 | $19,000 | $106,320 |
| 2019 | $1,446 | $104,190 | $19,000 | $85,190 |
| 2018 | $1,407 | $104,190 | $19,000 | $85,190 |
| 2017 | $1,407 | $104,190 | $19,000 | $85,190 |
| 2016 | $1,396 | $104,190 | $19,000 | $85,190 |
| 2015 | -- | $112,381 | $19,000 | $93,381 |
| 2014 | -- | $112,381 | $19,000 | $93,381 |
Source: Public Records
Map
Nearby Homes
- 3846 Countryaire Dr
- 3670 Highland Dr
- Sanford - Express Plan at Hobbs Farm
- Cali - Express Plan at Hobbs Farm
- Rachel - Express Plan at Hobbs Farm
- Brandon - Express Plan at Hobbs Farm
- Olivia - Express Plan at Hobbs Farm
- 3927 Winchester Dr
- 4080 Debbie Dr
- 333 Mangrove Ct
- 412 Pepperbush Ct
- 4009 Regina Ln
- 4137 N Lee St
- 3950 Sunny Ln
- 0 Hart St Unit 100427669
- 0 Hart St Unit 100427668
- 0 First St Unit 100427666
- 4204 Lee St
- 522 W 1st St
- 439 Second St
- 3877 Countryaire Dr
- 3877 Countryaire Dr Unit Nc
- 3707 Vista Ct
- 3885 Countryaire Dr
- 3790 Dover Dr
- 3874 Countryaire Dr
- 3780 Dover Dr
- 3870 Countryaire Dr
- 3878 Countryaire Dr
- 3857 Countryaire Dr
- 3703 Vista Ct
- 3862 Countryaire Dr
- 3776 Dover Dr
- 3706 Vista Ct
- 3884 Countryaire Dr
- 3702 Vista Ct
- 3888 Countryaire Dr
- 3772 Dover Dr
- 3793 Dover Dr
- 3854 Countryaire Dr