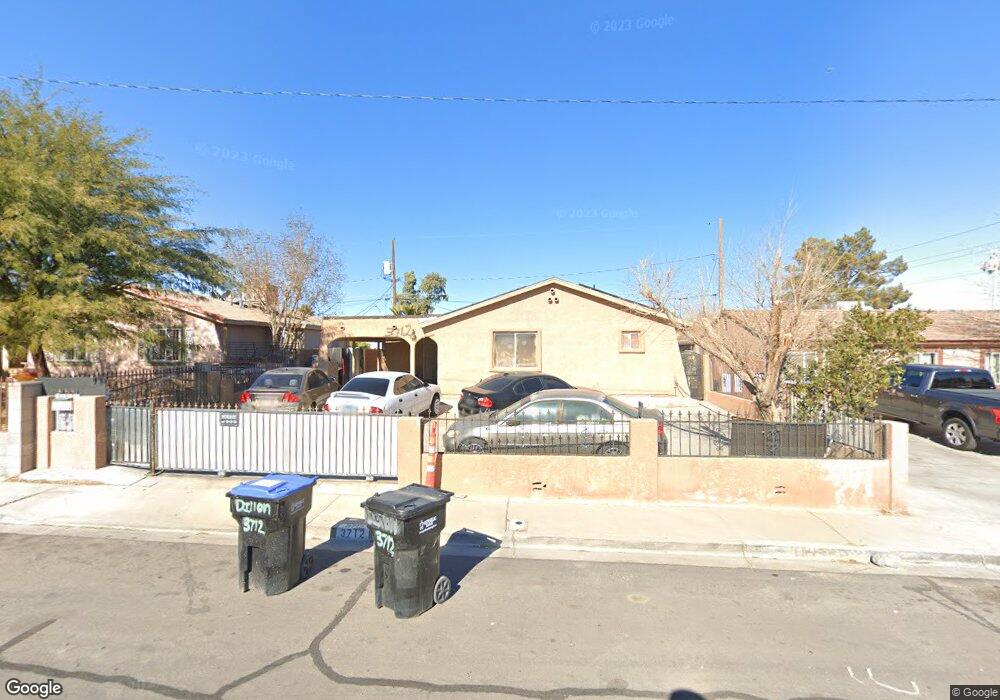
3712 Dillon Ave North Las Vegas, NV 89030
Downtown North Las Vegas NeighborhoodEstimated Value: $309,000 - $376,000
3
Beds
2
Baths
1,328
Sq Ft
$258/Sq Ft
Est. Value
About This Home
This home is located at 3712 Dillon Ave, North Las Vegas, NV 89030 and is currently estimated at $342,034, approximately $257 per square foot. 3712 Dillon Ave is a home located in Clark County with nearby schools including Jay W. Jeffers Elementary School, Von Tobel Middle School, and Sunrise Mountain High School.
Ownership History
Date
Name
Owned For
Owner Type
Purchase Details
Closed on
Aug 1, 2005
Sold by
Alcaraz Pinto Yeneceys and Coreas Urquilla Efrain
Bought by
Coreas Urquilla Efrain
Current Estimated Value
Home Financials for this Owner
Home Financials are based on the most recent Mortgage that was taken out on this home.
Original Mortgage
$132,000
Outstanding Balance
$68,537
Interest Rate
5.48%
Mortgage Type
New Conventional
Estimated Equity
$273,497
Purchase Details
Closed on
Mar 28, 2001
Sold by
Jablinski Pamela A Masi and Jablinski John T
Bought by
Coreas Urquilla Efrain
Home Financials for this Owner
Home Financials are based on the most recent Mortgage that was taken out on this home.
Original Mortgage
$95,060
Interest Rate
6.89%
Purchase Details
Closed on
May 14, 1997
Sold by
Masini Paul
Bought by
Masini Paul and Masi Paul
Create a Home Valuation Report for This Property
The Home Valuation Report is an in-depth analysis detailing your home's value as well as a comparison with similar homes in the area
Home Values in the Area
Average Home Value in this Area
Purchase History
| Date | Buyer | Sale Price | Title Company |
|---|---|---|---|
| Coreas Urquilla Efrain | -- | Lawyers Title Of Nevada | |
| Coreas Urquilla Efrain | $98,000 | First American Title Co | |
| Masini Paul | -- | -- |
Source: Public Records
Mortgage History
| Date | Status | Borrower | Loan Amount |
|---|---|---|---|
| Open | Coreas Urquilla Efrain | $132,000 | |
| Previous Owner | Coreas Urquilla Efrain | $95,060 |
Source: Public Records
Tax History Compared to Growth
Tax History
| Year | Tax Paid | Tax Assessment Tax Assessment Total Assessment is a certain percentage of the fair market value that is determined by local assessors to be the total taxable value of land and additions on the property. | Land | Improvement |
|---|---|---|---|---|
| 2025 | $1,170 | $51,446 | $25,900 | $25,546 |
| 2024 | $1,084 | $51,446 | $25,900 | $25,546 |
| 2023 | $721 | $51,611 | $26,600 | $25,011 |
| 2022 | $1,004 | $45,383 | $22,050 | $23,333 |
| 2021 | $929 | $41,738 | $19,250 | $22,488 |
| 2020 | $860 | $41,249 | $18,550 | $22,699 |
| 2019 | $806 | $36,719 | $14,000 | $22,719 |
| 2018 | $769 | $32,569 | $10,500 | $22,069 |
| 2017 | $1,005 | $29,971 | $7,350 | $22,621 |
| 2016 | $721 | $29,260 | $5,950 | $23,310 |
| 2015 | $719 | $27,873 | $4,550 | $23,323 |
| 2014 | $696 | $23,157 | $4,200 | $18,957 |
Source: Public Records
Map
Nearby Homes
- 2294 N Pecos Rd Unit 4
- 2294 N Pecos Rd
- 3640 Judson Ave
- 3572 Osaka Bay Ct
- 3308 Tabor Ave
- 3215 Dillon Ave
- 3308 E Lake Mead Blvd
- 3220 Orr Ave
- 3402 Lillis Cir
- 2082 Pillar Pointe St
- 2076 Pillar Pointe St
- 3104 Dillon Ave
- 3752 Calle de Rio Ave
- 3104 Twining Ave
- 4924 Chidlaw Ave Unit 3
- 3662 Via Mariposa Ave
- 1830 N Pecos Rd Unit 252
- 1830 N Pecos Rd Unit 137
- 1830 N Pecos Rd Unit 230
- 1947 Joyful St
- 3708 Dillon Ave
- 3716 Dillon Ave
- 3715 Judson Ave
- 3704 Dillon Ave
- 3709 Judson Ave
- 3717 Judson Ave
- 3705 Judson Ave
- 3705 Judson Ave
- 3700 Dillon Ave
- 3715 Dillon Ave
- 3695 Judson Ave
- 3709 Dillon Ave
- 3717 Dillon Ave
- 3701 Judson Ave
- 3705 Dillon Ave
- 3620 Dillon Ave
- 3617 Judson Ave
- 3621 Dillon Ave
- 3505 Judson Ave
- 3712 Twining Ave