Estimated Value: $220,000 - $235,000
2
Beds
2
Baths
1,110
Sq Ft
$204/Sq Ft
Est. Value
About This Home
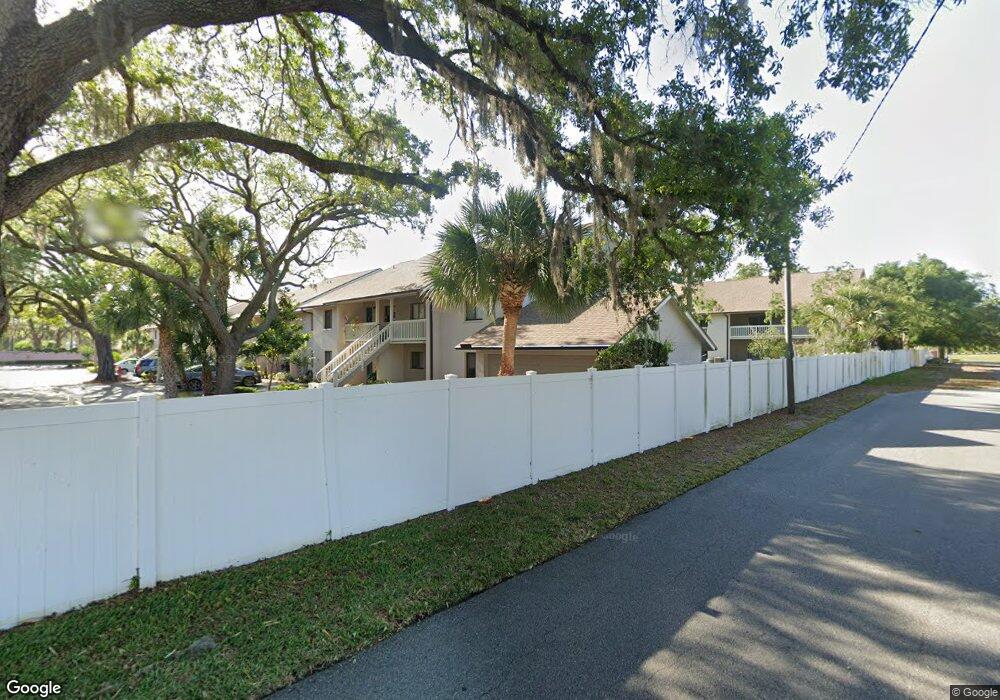
This home is located at 3712 Greenery Ct Unit 112, Tampa, FL 33618 and is currently estimated at $226,476, approximately $204 per square foot. 3712 Greenery Ct Unit 112 is a home located in Hillsborough County with nearby schools including Carrollwood Elementary School, Chamberlain High School, and Corbett Preparatory School of IDS.
Ownership History
Date
Name
Owned For
Owner Type
Purchase Details
Closed on
Mar 16, 2023
Sold by
Cernobyl Lamar M and Cernobyl Teresa Lyman
Bought by
Lamar M Cernobyl And Teresa L Cernobyl Living
Current Estimated Value
Purchase Details
Closed on
Jun 5, 2015
Sold by
Hajaistrom Shirley A
Bought by
Cernobyl Lamar M and Lyman Teresa D
Purchase Details
Closed on
Jun 17, 2004
Sold by
Cortes Lee M and Cortes Martha
Bought by
Hajaistron Shirley A
Home Financials for this Owner
Home Financials are based on the most recent Mortgage that was taken out on this home.
Original Mortgage
$71,120
Interest Rate
6.99%
Mortgage Type
Unknown
Purchase Details
Closed on
Oct 5, 2001
Sold by
Borrell Anthony J
Bought by
Cortes Lee M and Cortes Martha A
Home Financials for this Owner
Home Financials are based on the most recent Mortgage that was taken out on this home.
Original Mortgage
$62,550
Interest Rate
6.89%
Mortgage Type
New Conventional
Create a Home Valuation Report for This Property
The Home Valuation Report is an in-depth analysis detailing your home's value as well as a comparison with similar homes in the area
Home Values in the Area
Average Home Value in this Area
Purchase History
| Date | Buyer | Sale Price | Title Company |
|---|---|---|---|
| Lamar M Cernobyl And Teresa L Cernobyl Living | -- | -- | |
| Cernobyl Lamar M | $85,000 | Masterpiece Title | |
| Hajaistron Shirley A | $88,900 | Masterpiece Title | |
| Cortes Lee M | $69,500 | -- |
Source: Public Records
Mortgage History
| Date | Status | Borrower | Loan Amount |
|---|---|---|---|
| Previous Owner | Hajaistron Shirley A | $71,120 | |
| Previous Owner | Cortes Lee M | $62,550 |
Source: Public Records
Tax History Compared to Growth
Tax History
| Year | Tax Paid | Tax Assessment Tax Assessment Total Assessment is a certain percentage of the fair market value that is determined by local assessors to be the total taxable value of land and additions on the property. | Land | Improvement |
|---|---|---|---|---|
| 2024 | $658 | $78,555 | -- | -- |
| 2023 | $620 | $76,267 | $0 | $0 |
| 2022 | $596 | $74,046 | $0 | $0 |
| 2021 | $601 | $71,889 | $0 | $0 |
| 2020 | $667 | $70,896 | $0 | $0 |
| 2019 | $665 | $69,302 | $0 | $0 |
| 2018 | $663 | $68,010 | $0 | $0 |
| 2017 | $659 | $71,201 | $0 | $0 |
| 2016 | $656 | $65,241 | $0 | $0 |
| 2015 | $1,224 | $61,456 | $0 | $0 |
| 2014 | -- | $52,467 | $0 | $0 |
| 2013 | -- | $47,697 | $0 | $0 |
Source: Public Records
Map
Nearby Homes
- 3706 Greenery Ct Unit 206
- 3709 Greenery Ct Unit 209
- 9804 Lombard Ct Unit 104
- 10356 Carrollwood Ln Unit 204
- 10330 Carrollwood Ln Unit 95
- 9586 Troutwater Ln
- 2 Troutwater Ln Troutwater Ln
- 10403 Lake Carroll Way
- 4004 Cortez Dr Unit D
- 3407 W Busch Blvd
- 10408 Butia Place
- 3804 Cortez Cir Unit A
- 4118 Gauge Line Loop
- 10415 Butia Place
- 10423 Carrollbrook Cir Unit 102
- 10423 Carrollbrook Cir Unit 203
- 4036 Cortez Dr Unit A
- 3802 Cortez Cir Unit C
- 3802 Cortez Cir Unit D
- 3822 Cortez Dr Unit D
- 3712 Greenery Ct Unit 212
- 3706 Greenery Ct
- 3706 Greenery Ct Unit 106
- 3711 Greenery Ct Unit 211
- 3711 Greenery Ct Unit 111
- 3702 Greenery Ct Unit 102
- 3702 Greenery Ct Unit 202
- 3715 Champagne Dr Unit 217
- 3715 Champagne Dr Unit 117
- 3705 Champagne Dr Unit 205
- 3705 Champagne Dr Unit 105
- 9808 Lombard Ct Unit 208
- 9808 Lombard Ct Unit 108
- 9812 Lombard Ct Unit 212
- 9812 Lombard Ct Unit 112
- 9810 Lombard Ct Unit 210
- 9810 Lombard Ct Unit 110
- 9803 Lombard Ct Unit 103
- 3701 Champagne Dr Unit 101