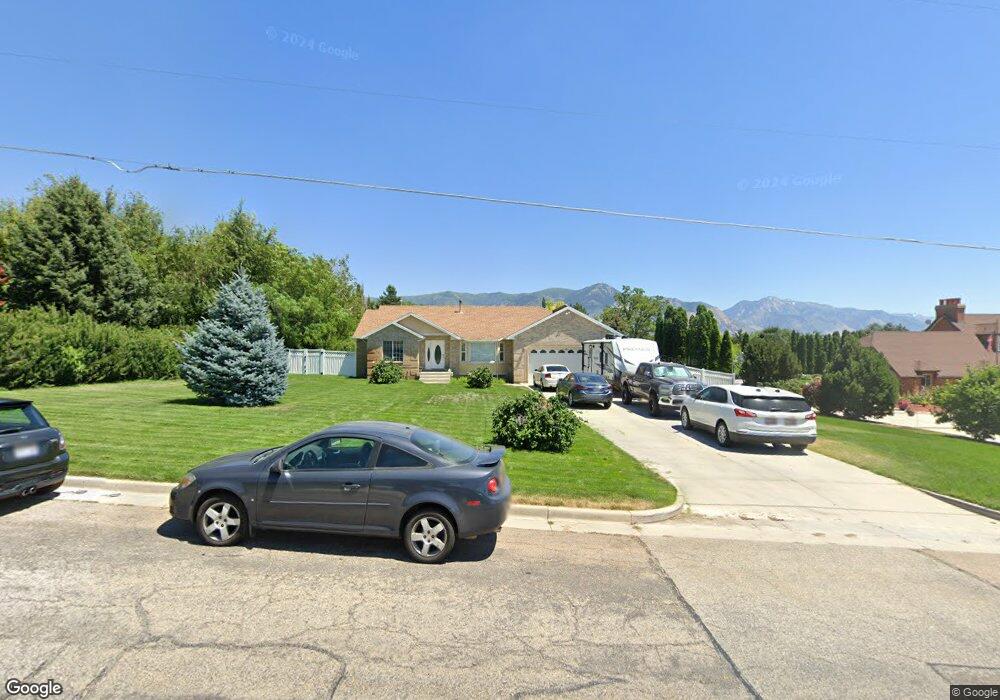
3712 N 1100 W Pleasant View, UT 84414
Estimated Value: $629,000 - $1,339,000
5
Beds
3
Baths
3,674
Sq Ft
$245/Sq Ft
Est. Value
About This Home
This home is located at 3712 N 1100 W, Pleasant View, UT 84414 and is currently estimated at $901,169, approximately $245 per square foot. 3712 N 1100 W is a home located in Weber County with nearby schools including Lomond View School, Orion Junior High School, and Weber High School.
Ownership History
Date
Name
Owned For
Owner Type
Purchase Details
Closed on
Aug 30, 2013
Sold by
Wood Kimberly A and Perr Kimberly A
Bought by
Perry David N
Current Estimated Value
Home Financials for this Owner
Home Financials are based on the most recent Mortgage that was taken out on this home.
Original Mortgage
$255,000
Outstanding Balance
$64,798
Interest Rate
4.27%
Mortgage Type
New Conventional
Estimated Equity
$836,371
Purchase Details
Closed on
Dec 21, 2004
Sold by
Wood Michael L
Bought by
Wood Kimberly A
Home Financials for this Owner
Home Financials are based on the most recent Mortgage that was taken out on this home.
Original Mortgage
$70,771
Interest Rate
5.76%
Mortgage Type
New Conventional
Purchase Details
Closed on
Apr 1, 1998
Sold by
Fowers Leon Kent and Fowers Juanita B
Bought by
Wood Michael L
Create a Home Valuation Report for This Property
The Home Valuation Report is an in-depth analysis detailing your home's value as well as a comparison with similar homes in the area
Home Values in the Area
Average Home Value in this Area
Purchase History
| Date | Buyer | Sale Price | Title Company |
|---|---|---|---|
| Perry David N | -- | Gt Title Kaysville | |
| Wood Kimberly A | -- | Bonneville Title Company Cle | |
| Wood Michael L | -- | Mountain View Title |
Source: Public Records
Mortgage History
| Date | Status | Borrower | Loan Amount |
|---|---|---|---|
| Open | Perry David N | $255,000 | |
| Closed | Wood Kimberly A | $70,771 |
Source: Public Records
Tax History Compared to Growth
Tax History
| Year | Tax Paid | Tax Assessment Tax Assessment Total Assessment is a certain percentage of the fair market value that is determined by local assessors to be the total taxable value of land and additions on the property. | Land | Improvement |
|---|---|---|---|---|
| 2025 | $4,857 | $757,684 | $155,632 | $602,052 |
| 2024 | $4,676 | $743,000 | $155,632 | $587,368 |
| 2023 | $4,371 | $697,000 | $154,550 | $542,450 |
| 2022 | $4,314 | $705,000 | $149,476 | $555,524 |
| 2021 | $3,596 | $543,000 | $129,172 | $413,828 |
| 2020 | $3,165 | $438,000 | $113,457 | $324,543 |
| 2019 | $3,237 | $429,000 | $113,457 | $315,543 |
| 2018 | $3,313 | $423,000 | $67,335 | $355,665 |
| 2017 | $3,175 | $382,000 | $67,335 | $314,665 |
| 2016 | $3,014 | $197,451 | $37,338 | $160,113 |
| 2015 | $2,682 | $172,372 | $37,338 | $135,034 |
| 2014 | $2,720 | $172,372 | $37,338 | $135,034 |
Source: Public Records
Map
Nearby Homes
- 1012 W 3550 N
- 993 W 3800 N
- 0 W Pleasant View Dr
- 3875 N 1000 W
- 3862 N 900 W
- 1023 W 3350 N
- 1199 W Fallow Way
- 1130 Fawn Dr
- 735 W 3500 N
- 1211 W Fallow Way
- 4050 N 1100 W
- 1276 W Fallow Way
- 2700 N 600 W
- 3414 N 1160 W Unit 214-R
- 567 W 3650 N
- 1616 W 3125 N Unit 7
- 1621 W 3125 N Unit 4
- 1629 W 3125 N Unit 5
- 4185 N Moose Dr Unit 126
- 4211 N Moose Dr Unit 128