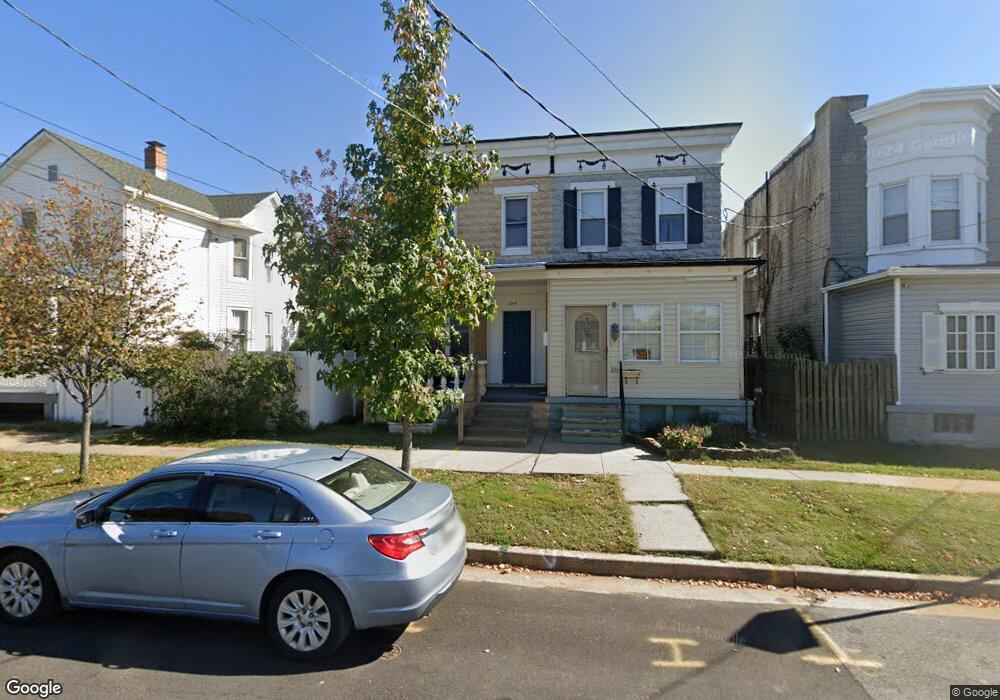
3713 4th St Brooklyn, MD 21225
Estimated Value: $145,883 - $158,000
3
Beds
2
Baths
1,344
Sq Ft
$113/Sq Ft
Est. Value
About This Home
This home is located at 3713 4th St, Brooklyn, MD 21225 and is currently estimated at $151,942, approximately $113 per square foot. 3713 4th St is a home located in Baltimore City with nearby schools including Maree Garnett Farring Elementary School, Booker T. Washington Middle School, and Benjamin Franklin High School.
Ownership History
Date
Name
Owned For
Owner Type
Purchase Details
Closed on
Jun 1, 2015
Sold by
Bessling Steve F and Bessling April R
Bought by
Bessling Properties Llc
Current Estimated Value
Purchase Details
Closed on
Feb 23, 2007
Sold by
Drasher John M
Bought by
Bessling Steve F and Bessling April R
Home Financials for this Owner
Home Financials are based on the most recent Mortgage that was taken out on this home.
Original Mortgage
$58,400
Interest Rate
8.25%
Mortgage Type
Purchase Money Mortgage
Purchase Details
Closed on
Jun 25, 1992
Sold by
Cox Melvin G
Bought by
Drasher John M
Create a Home Valuation Report for This Property
The Home Valuation Report is an in-depth analysis detailing your home's value as well as a comparison with similar homes in the area
Home Values in the Area
Average Home Value in this Area
Purchase History
| Date | Buyer | Sale Price | Title Company |
|---|---|---|---|
| Bessling Properties Llc | -- | Attorney | |
| Bessling Steve F | $74,000 | -- | |
| Drasher John M | $69,900 | -- |
Source: Public Records
Mortgage History
| Date | Status | Borrower | Loan Amount |
|---|---|---|---|
| Previous Owner | Bessling Steve F | $58,400 | |
| Previous Owner | Bessling Steve F | $14,600 |
Source: Public Records
Tax History
| Year | Tax Paid | Tax Assessment Tax Assessment Total Assessment is a certain percentage of the fair market value that is determined by local assessors to be the total taxable value of land and additions on the property. | Land | Improvement |
|---|---|---|---|---|
| 2025 | $1,726 | $76,800 | -- | -- |
| 2024 | $1,726 | $73,500 | -- | -- |
| 2023 | $1,649 | $70,200 | $14,000 | $56,200 |
| 2022 | $1,499 | $63,500 | $0 | $0 |
| 2021 | $1,340 | $56,800 | $0 | $0 |
| 2020 | $1,182 | $50,100 | $12,000 | $38,100 |
| 2019 | $1,177 | $50,100 | $12,000 | $38,100 |
| 2018 | $1,182 | $50,100 | $12,000 | $38,100 |
| 2017 | $1,182 | $50,100 | $0 | $0 |
| 2016 | $1,663 | $50,100 | $0 | $0 |
| 2015 | $1,663 | $50,100 | $0 | $0 |
| 2014 | $1,663 | $70,200 | $0 | $0 |
Source: Public Records
Map
Nearby Homes
Your Personal Tour Guide
Ask me questions while you tour the home.