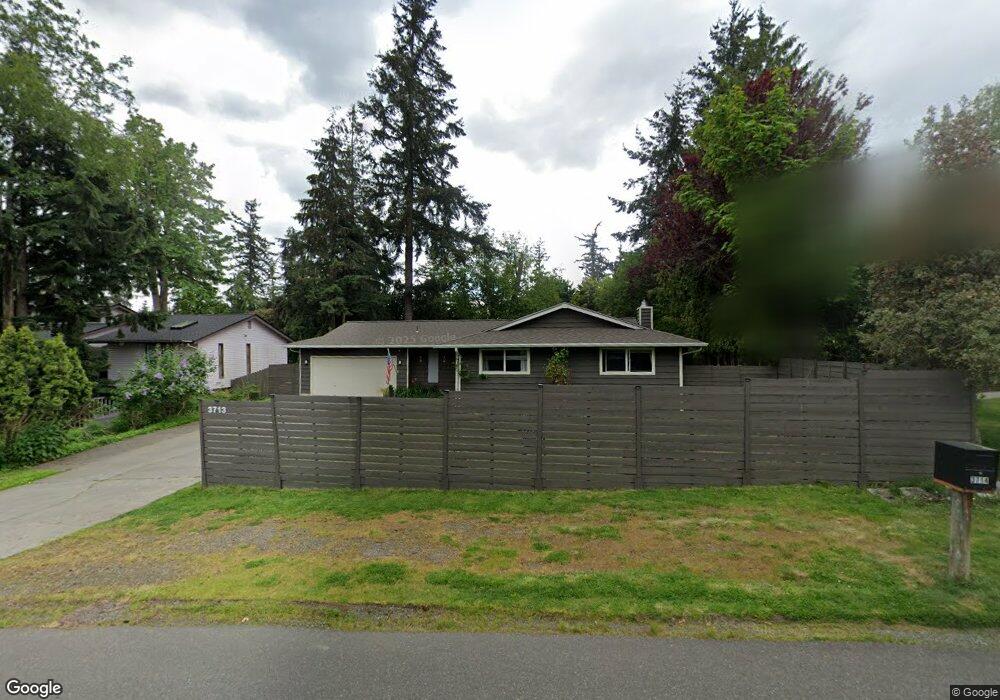
3713 Beazer Rd Bellingham, WA 98226
Estimated Value: $614,620 - $683,000
3
Beds
2
Baths
1,433
Sq Ft
$451/Sq Ft
Est. Value
About This Home
This home is located at 3713 Beazer Rd, Bellingham, WA 98226 and is currently estimated at $645,905, approximately $450 per square foot. 3713 Beazer Rd is a home located in Whatcom County with nearby schools including Silver Beach Elementary School, Whatcom Middle School, and Squalicum High School.
Ownership History
Date
Name
Owned For
Owner Type
Purchase Details
Closed on
Nov 16, 2018
Sold by
Dean David R
Bought by
Dean David R and Maudsley Jeffrey A
Current Estimated Value
Home Financials for this Owner
Home Financials are based on the most recent Mortgage that was taken out on this home.
Original Mortgage
$174,000
Outstanding Balance
$152,685
Interest Rate
4.7%
Mortgage Type
New Conventional
Estimated Equity
$493,220
Purchase Details
Closed on
Feb 15, 2006
Sold by
Dean Sandra L
Bought by
Dean David R
Home Financials for this Owner
Home Financials are based on the most recent Mortgage that was taken out on this home.
Original Mortgage
$180,000
Interest Rate
5.85%
Mortgage Type
Fannie Mae Freddie Mac
Purchase Details
Closed on
Aug 27, 2003
Sold by
Mccandless James C and Mccandless Ann
Bought by
Dean David R and Dean Sandra L
Home Financials for this Owner
Home Financials are based on the most recent Mortgage that was taken out on this home.
Original Mortgage
$105,000
Interest Rate
5.6%
Mortgage Type
Purchase Money Mortgage
Create a Home Valuation Report for This Property
The Home Valuation Report is an in-depth analysis detailing your home's value as well as a comparison with similar homes in the area
Home Values in the Area
Average Home Value in this Area
Purchase History
| Date | Buyer | Sale Price | Title Company |
|---|---|---|---|
| Dean David R | -- | Whatcom Land Title Co Inc | |
| Dean David R | -- | First American Title Insuran | |
| Dean David R | $159,016 | Whatcom Land Title |
Source: Public Records
Mortgage History
| Date | Status | Borrower | Loan Amount |
|---|---|---|---|
| Open | Dean David R | $174,000 | |
| Closed | Dean David R | $180,000 | |
| Previous Owner | Dean David R | $105,000 |
Source: Public Records
Tax History Compared to Growth
Tax History
| Year | Tax Paid | Tax Assessment Tax Assessment Total Assessment is a certain percentage of the fair market value that is determined by local assessors to be the total taxable value of land and additions on the property. | Land | Improvement |
|---|---|---|---|---|
| 2024 | $4,610 | $507,525 | $213,840 | $293,685 |
| 2023 | $4,610 | $529,847 | $223,245 | $306,602 |
| 2022 | $3,684 | $430,770 | $181,500 | $249,270 |
| 2021 | $3,730 | $356,008 | $150,000 | $206,008 |
| 2020 | $3,570 | $339,113 | $132,405 | $206,708 |
| 2019 | $3,112 | $316,856 | $123,803 | $193,053 |
| 2018 | $3,227 | $284,201 | $111,053 | $173,148 |
| 2017 | $2,810 | $251,463 | $98,260 | $153,203 |
| 2016 | $2,595 | $228,557 | $89,420 | $139,137 |
| 2015 | $2,620 | $217,701 | $85,000 | $132,701 |
| 2014 | -- | $213,780 | $82,560 | $131,220 |
| 2013 | -- | $204,941 | $80,000 | $124,941 |
Source: Public Records
Map
Nearby Homes
- 4055 Springland Ct
- 1379 Northwood Ct
- 3852 Del Bonita Way
- 3785 Greenville Place
- 1314 Welling Rd
- 3159 Chandler Pkwy
- 3155 Chandler Pkwy
- 3153 Chandler Pkwy
- 1430 Welling Rd
- 4431 Alice St
- 4414 Alice St
- 3527 Sussex Dr
- 4020 Academy St
- 3666 Woodlake Rd
- 1580 Hillsdale Rd
- 3713 Bristol St
- 3709 Bristol St
- 3871 Cindy Ln
- 1368 Roma Rd
- 3826 Gala Loop
- 3709 Beazer Rd
- 3719 Beazer Rd
- 3704 Lahti Ct
- 1315 Andrea Ct
- 3703 Beazer Rd
- 3714 Beazer Rd
- 3698 Lahti Ct
- 3710 Beazer Rd
- 3720 Beazer Rd
- 3712 Lahti Ct
- 3697 Beazer Rd
- 3731 Beazer Rd
- 3726 Beazer Rd
- 3706 Beazer Rd
- 1317 Andrea Ct
- 1344 Lahti Dr
- 1350 Lahti Dr
- 1316 Andrea Ct
- 1319 Heritage Hills Ct
- 3700 Beazer Rd