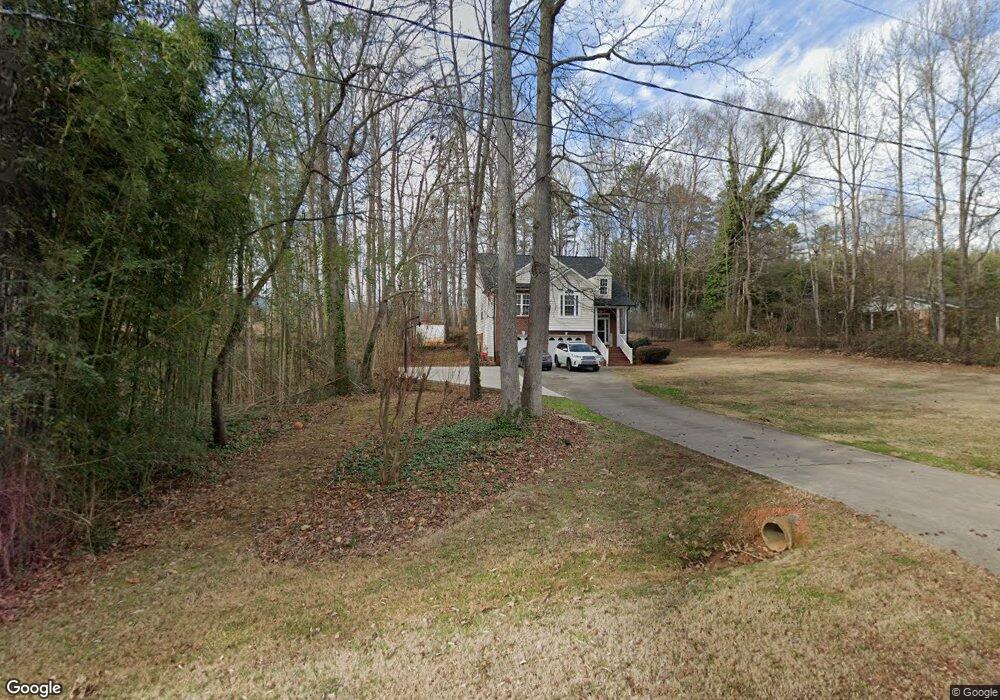
3713 Pinecrest Dr Gastonia, NC 28056
Estimated Value: $322,000 - $386,000
3
Beds
2
Baths
1,408
Sq Ft
$254/Sq Ft
Est. Value
About This Home
This home is located at 3713 Pinecrest Dr, Gastonia, NC 28056 and is currently estimated at $358,111, approximately $254 per square foot. 3713 Pinecrest Dr is a home located in Gaston County with nearby schools including New Hope Elementary School, Cramerton Middle School, and Forestview High School.
Ownership History
Date
Name
Owned For
Owner Type
Purchase Details
Closed on
Sep 23, 2011
Sold by
Wright Angela Simmons
Bought by
Simmons Angela M
Current Estimated Value
Home Financials for this Owner
Home Financials are based on the most recent Mortgage that was taken out on this home.
Original Mortgage
$127,000
Outstanding Balance
$49,874
Interest Rate
4.24%
Mortgage Type
New Conventional
Estimated Equity
$308,237
Purchase Details
Closed on
Nov 10, 2005
Sold by
Wright Jesse Lane
Bought by
Wright Angela Simmons
Purchase Details
Closed on
Oct 31, 2002
Sold by
Keg Construction Inc
Bought by
Wright Jesse L
Home Financials for this Owner
Home Financials are based on the most recent Mortgage that was taken out on this home.
Original Mortgage
$146,200
Interest Rate
6.01%
Mortgage Type
Purchase Money Mortgage
Create a Home Valuation Report for This Property
The Home Valuation Report is an in-depth analysis detailing your home's value as well as a comparison with similar homes in the area
Home Values in the Area
Average Home Value in this Area
Purchase History
| Date | Buyer | Sale Price | Title Company |
|---|---|---|---|
| Simmons Angela M | -- | None Available | |
| Wright Angela Simmons | -- | -- | |
| Wright Jesse L | $154,000 | -- |
Source: Public Records
Mortgage History
| Date | Status | Borrower | Loan Amount |
|---|---|---|---|
| Open | Simmons Angela M | $127,000 | |
| Previous Owner | Wright Jesse L | $146,200 |
Source: Public Records
Tax History
| Year | Tax Paid | Tax Assessment Tax Assessment Total Assessment is a certain percentage of the fair market value that is determined by local assessors to be the total taxable value of land and additions on the property. | Land | Improvement |
|---|---|---|---|---|
| 2025 | $3,705 | $346,610 | $30,230 | $316,380 |
| 2024 | $3,705 | $346,610 | $30,230 | $316,380 |
| 2023 | $3,743 | $346,610 | $30,230 | $316,380 |
| 2022 | $2,553 | $191,950 | $26,040 | $165,910 |
| 2021 | $2,591 | $191,950 | $26,040 | $165,910 |
| 2020 | $2,591 | $191,950 | $26,040 | $165,910 |
| 2019 | $2,611 | $191,950 | $26,040 | $165,910 |
| 2018 | $2,189 | $156,333 | $24,000 | $132,333 |
| 2017 | $2,189 | $156,333 | $24,000 | $132,333 |
| 2016 | $2,189 | $156,333 | $0 | $0 |
| 2014 | $2,421 | $172,913 | $45,000 | $127,913 |
Source: Public Records
Map
Nearby Homes
- 2657 Norman St
- 3160 Evan Ct
- 3172 Evan Ct
- 3406 Austin Duncan Dr
- 3163 Evan Ct
- 3409 Austin Duncan Dr
- 3326 Austin Duncan Dr
- 3401 Austin Duncan Dr
- 3310 Austin Duncan Dr
- 3329 Austin Duncan Dr
- 3313 Austin Duncan Dr
- 4261 Round Table Dr
- 3733 Catawba Creek Dr
- 3825 Quay Ct
- 4187 Timberwood Dr
- 4307 Round Table Dr
- 4325 Donnell Dr
- 4301 Round Table Dr
- 4285 Round Table Dr
- 4273 Round Table Dr
- 3736 Pinecrest Dr
- 3717 Pinecrest Dr
- 3709 Pinecrest Dr
- 201 Stroupe Rd
- 3721 Pinecrest Dr
- 3712 Pinecrest Dr
- Lot 11 Block E Pinecrest Dr
- 3710 Pinecrest Dr
- 232 Stroupe Rd
- 4489 Posterity Ct
- 4489 Posterity Ct Unit 1A
- 3720 Pinecrest Dr Unit 9
- 4492 Lamar Ave
- 3708 Pinecrest Dr
- 3725 Pinecrest Dr
- 4486 Lamar Ave
- 3713 Bellevue Terrace
- 302 Stroupe Rd
- 3709 Bellevue Terrace
- Lot 8 S Pinecrest Dr
Your Personal Tour Guide
Ask me questions while you tour the home.