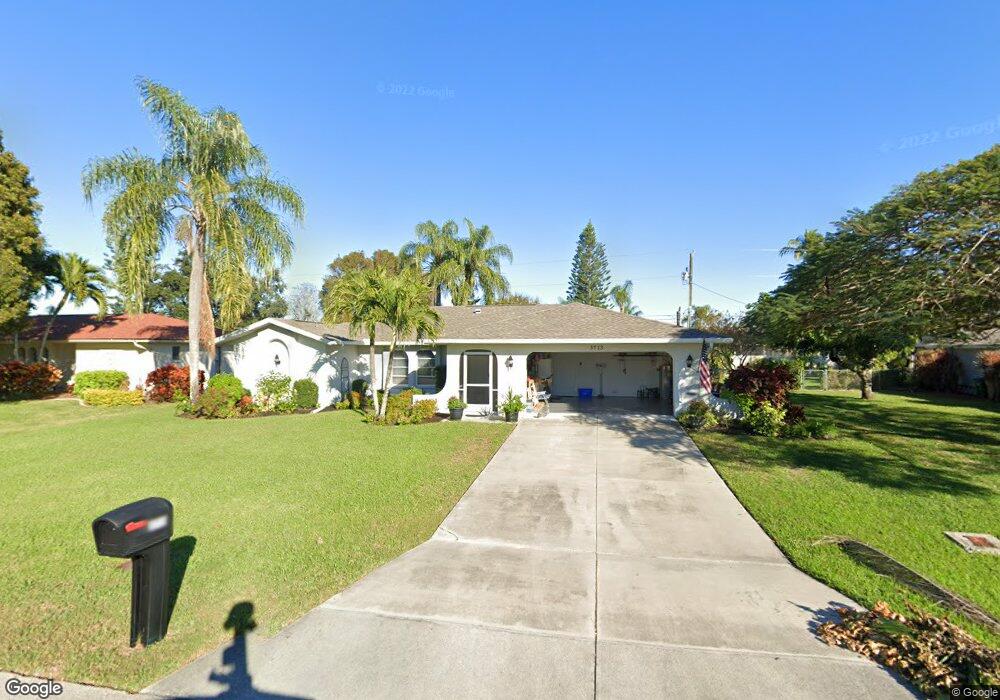
3713 SE 3rd Place Unit 7 Cape Coral, FL 33904
Bimini Basin NeighborhoodEstimated Value: $299,000 - $313,000
3
Beds
2
Baths
2,285
Sq Ft
$135/Sq Ft
Est. Value
About This Home
This home is located at 3713 SE 3rd Place Unit 7, Cape Coral, FL 33904 and is currently estimated at $308,521, approximately $135 per square foot. 3713 SE 3rd Place Unit 7 is a home located in Lee County with nearby schools including Cape Elementary School, Caloosa Elementary School, and Tropic Isles Elementary School.
Ownership History
Date
Name
Owned For
Owner Type
Purchase Details
Closed on
Mar 14, 2025
Sold by
Robison Properties Llc
Bought by
Betts Lori
Current Estimated Value
Home Financials for this Owner
Home Financials are based on the most recent Mortgage that was taken out on this home.
Original Mortgage
$248,000
Outstanding Balance
$246,750
Interest Rate
6.95%
Mortgage Type
New Conventional
Estimated Equity
$61,771
Purchase Details
Closed on
Dec 31, 2014
Sold by
Summers John and Summers Judith
Bought by
Robison Properties Llc
Purchase Details
Closed on
Dec 30, 2005
Sold by
Mastroianni Amo
Bought by
Summers John and Summers Judith
Purchase Details
Closed on
Mar 26, 2001
Sold by
Matroianni Amo and Mastroianni Mary L
Bought by
Mastroianni Amo
Create a Home Valuation Report for This Property
The Home Valuation Report is an in-depth analysis detailing your home's value as well as a comparison with similar homes in the area
Home Values in the Area
Average Home Value in this Area
Purchase History
| Date | Buyer | Sale Price | Title Company |
|---|---|---|---|
| Betts Lori | $310,000 | Title Group | |
| Robison Properties Llc | $174,000 | Palm Title Associates Inc | |
| Summers John | $250,000 | Jm Title Corporation | |
| Mastroianni Amo | -- | -- | |
| Mastroianni Amo | -- | -- |
Source: Public Records
Mortgage History
| Date | Status | Borrower | Loan Amount |
|---|---|---|---|
| Open | Betts Lori | $248,000 |
Source: Public Records
Tax History Compared to Growth
Tax History
| Year | Tax Paid | Tax Assessment Tax Assessment Total Assessment is a certain percentage of the fair market value that is determined by local assessors to be the total taxable value of land and additions on the property. | Land | Improvement |
|---|---|---|---|---|
| 2025 | $5,076 | $275,696 | $87,210 | $188,486 |
| 2024 | $5,076 | $260,072 | -- | -- |
| 2023 | $5,114 | $236,429 | $0 | $0 |
| 2022 | $4,440 | $214,935 | $0 | $0 |
| 2021 | $3,963 | $195,395 | $24,000 | $171,395 |
| 2020 | $3,765 | $177,642 | $29,200 | $148,442 |
| 2019 | $3,694 | $175,225 | $27,300 | $147,925 |
| 2018 | $3,536 | $163,117 | $26,000 | $137,117 |
| 2017 | $3,458 | $163,916 | $20,000 | $143,916 |
| 2016 | $3,141 | $141,927 | $20,000 | $121,927 |
| 2015 | $2,909 | $125,405 | $15,300 | $110,105 |
| 2014 | $2,637 | $114,800 | $13,700 | $101,100 |
| 2013 | -- | $102,503 | $9,800 | $92,703 |
Source: Public Records
Map
Nearby Homes
- 3734 SE 3rd Place
- 3810 Palm Tree Blvd
- 3612 SE 5th Ave
- 3822 Palm Tree Blvd
- 3823 Palm Tree Blvd
- 3602 SE 2nd Ave
- 3819 SE 2nd Ave
- 3625 SE 5th Ct
- 3918 Palm Tree Blvd
- 532 SE 36th St
- 3528 SE 1st Place
- 3702 SE 6th Ave
- 3728 SE 1st Ave
- 3926 Palm Tree Blvd
- 3606 SE 1st Ave
- 3420 SE 5th Place
- 407 SE 34th Terrace
- 3756 SE 1st Ave
- 111 SE 37th Terrace
- 318 SE 33rd Terrace
- 3709 SE 3rd Place
- 3717 SE 3rd Place
- 3718 SE 4th Ave
- 3712 SE 4th Ave
- 3705 SE 3rd Place
- 3714 SE 3rd Place
- 3718 SE 3rd Place
- 3710 SE 3rd Place
- 3723 SE 3rd Place
- 3706 SE 4th Ave
- 3722 SE 3rd Place Unit 26
- 3706 SE 3rd Place
- 3724 SE 4th Ave
- 3701 SE 3rd Place
- 3702 SE 4th Ave
- 3727 SE 3rd Place
- 3726 SE 3rd Place
- 3713 SE 3rd Ave
- 3702 SE 3rd Place