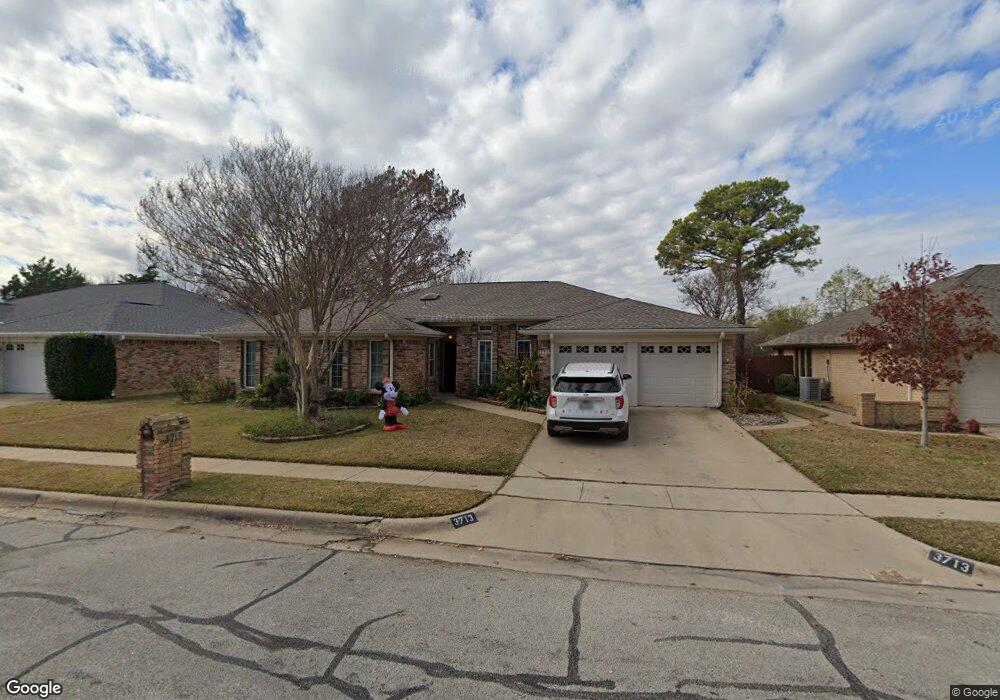
3713 Woodmont Ct Bedford, TX 76021
Estimated Value: $465,000 - $529,000
4
Beds
3
Baths
2,235
Sq Ft
$224/Sq Ft
Est. Value
About This Home
This home is located at 3713 Woodmont Ct, Bedford, TX 76021 and is currently estimated at $500,125, approximately $223 per square foot. 3713 Woodmont Ct is a home located in Tarrant County with nearby schools including Bedford Heights Elementary School, Bedford Junior High School, and L.D. Bell High School.
Ownership History
Date
Name
Owned For
Owner Type
Purchase Details
Closed on
Nov 9, 2018
Sold by
Bemh Joseph H and Schenk Karen M
Bought by
Lindsey Harry and Barber Kenneth
Current Estimated Value
Home Financials for this Owner
Home Financials are based on the most recent Mortgage that was taken out on this home.
Original Mortgage
$238,000
Outstanding Balance
$206,275
Interest Rate
4.12%
Mortgage Type
Purchase Money Mortgage
Estimated Equity
$293,850
Create a Home Valuation Report for This Property
The Home Valuation Report is an in-depth analysis detailing your home's value as well as a comparison with similar homes in the area
Home Values in the Area
Average Home Value in this Area
Purchase History
| Date | Buyer | Sale Price | Title Company |
|---|---|---|---|
| Lindsey Harry | -- | Independence Title Co |
Source: Public Records
Mortgage History
| Date | Status | Borrower | Loan Amount |
|---|---|---|---|
| Open | Lindsey Harry | $238,000 |
Source: Public Records
Tax History Compared to Growth
Tax History
| Year | Tax Paid | Tax Assessment Tax Assessment Total Assessment is a certain percentage of the fair market value that is determined by local assessors to be the total taxable value of land and additions on the property. | Land | Improvement |
|---|---|---|---|---|
| 2025 | $7,025 | $414,000 | $90,000 | $324,000 |
| 2024 | $7,025 | $454,000 | $90,000 | $364,000 |
| 2023 | $7,493 | $429,556 | $75,000 | $354,556 |
| 2022 | $7,757 | $396,280 | $75,000 | $321,280 |
| 2021 | $7,605 | $349,744 | $75,000 | $274,744 |
| 2020 | $6,978 | $293,501 | $75,000 | $218,501 |
| 2019 | $7,130 | $293,500 | $75,000 | $218,500 |
| 2018 | $3,347 | $289,493 | $75,000 | $214,493 |
| 2017 | $6,367 | $280,229 | $25,000 | $255,229 |
| 2016 | $5,788 | $254,020 | $25,000 | $229,020 |
| 2015 | $3,327 | $217,500 | $25,000 | $192,500 |
| 2014 | $3,327 | $217,500 | $25,000 | $192,500 |
Source: Public Records
Map
Nearby Homes
- 1109 Simpson Terrace
- 1136 Wingate Dr
- 3624 Wayne Ct
- 909 Brestol Ct W
- 3907 Copperwood Ct
- 3609 Wayne Ct
- 4002 Copperwood Ct
- 1209 Hillandale Ct
- 628 Huntwich Dr
- 1303 Crest Dr
- 3605 Spring Valley Dr
- 3301 Wendover Ct
- 4105 Inwood Ln
- 1421 Plantation Dr N
- 913 Kensington Ct
- 3827 Ashbury Ln
- 3213 Spring Valley Dr
- 3119 Spring Grove Dr
- 405 Woodbriar Ct
- 3907 Windermere Dr
- 3709 Woodmont Ct
- 3717 Woodmont Ct
- 3721 Woodmont Ct
- 3705 Woodmont Ct
- 3712 Woodmont Ct
- 3716 Woodmont Ct
- 3708 Woodmont Ct
- 3725 Woodmont Ct
- 3720 Woodmont Ct
- 3701 Woodmont Ct
- 3704 Woodmont Ct
- 3724 Woodmont Ct
- 3709 Windomere Dr
- 3705 Windomere Dr
- 3729 Woodmont Ct
- 3700 Woodmont Ct
- 3713 Windomere Dr
- 3717 Windomere Dr
- 3701 Windomere Dr
- 3728 Woodmont Ct