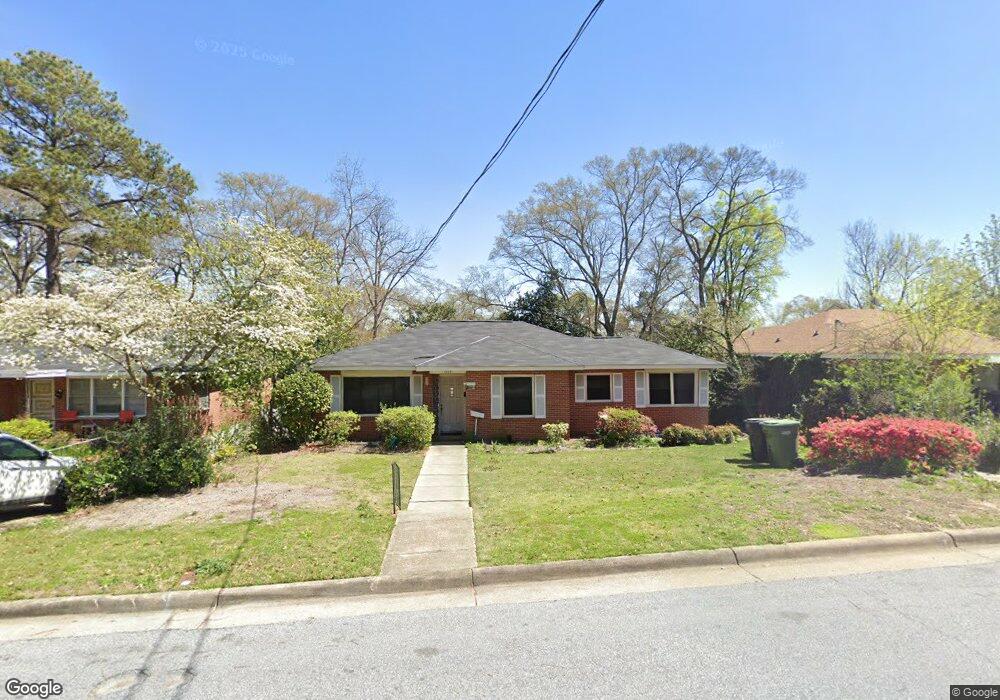
3714 Howard Ave Columbus, GA 31904
Estimated Value: $148,000 - $197,000
4
Beds
3
Baths
1,536
Sq Ft
$111/Sq Ft
Est. Value
About This Home
This home is located at 3714 Howard Ave, Columbus, GA 31904 and is currently estimated at $170,536, approximately $111 per square foot. 3714 Howard Ave is a home located in Muscogee County with nearby schools including Johnson Elementary School, Richards Middle School, and Jordan Vocational High School.
Ownership History
Date
Name
Owned For
Owner Type
Purchase Details
Closed on
May 8, 2023
Sold by
Wright Hannah
Bought by
Tanner Evan R
Current Estimated Value
Purchase Details
Closed on
Mar 1, 2021
Sold by
Tanner Robert Jack
Bought by
Tanner Evan R and Wright Hannah
Purchase Details
Closed on
Mar 30, 2020
Sold by
Davis Louise H Estate
Bought by
Tanner Evan R and Tanner Robert Jack
Purchase Details
Closed on
Oct 27, 2015
Sold by
Davis Jack E
Bought by
Davis Louise H
Create a Home Valuation Report for This Property
The Home Valuation Report is an in-depth analysis detailing your home's value as well as a comparison with similar homes in the area
Home Values in the Area
Average Home Value in this Area
Purchase History
| Date | Buyer | Sale Price | Title Company |
|---|---|---|---|
| Tanner Evan R | -- | None Listed On Document | |
| Tanner Evan R | -- | -- | |
| Tanner Evan R | -- | -- | |
| Davis Louise H | -- | -- |
Source: Public Records
Tax History Compared to Growth
Tax History
| Year | Tax Paid | Tax Assessment Tax Assessment Total Assessment is a certain percentage of the fair market value that is determined by local assessors to be the total taxable value of land and additions on the property. | Land | Improvement |
|---|---|---|---|---|
| 2025 | $187 | $60,964 | $7,968 | $52,996 |
| 2024 | $1,869 | $60,964 | $7,968 | $52,996 |
| 2023 | $2,401 | $60,964 | $7,968 | $52,996 |
| 2022 | $1,977 | $48,408 | $7,968 | $40,440 |
| 2021 | $1,870 | $45,788 | $7,968 | $37,820 |
| 2020 | $1,870 | $45,788 | $7,968 | $37,820 |
| 2019 | $13 | $45,788 | $7,968 | $37,820 |
| 2018 | $13 | $45,788 | $7,968 | $37,820 |
| 2017 | $14 | $45,788 | $7,968 | $37,820 |
| 2016 | $16 | $25,169 | $2,600 | $22,569 |
| 2015 | $17 | $25,169 | $2,600 | $22,569 |
| 2014 | $18 | $25,169 | $2,600 | $22,569 |
| 2013 | $20 | $25,169 | $2,600 | $22,569 |
Source: Public Records
Map
Nearby Homes
- 3708 Howard Ave
- 3724 Howard Ave
- 3702 Howard Ave
- 3707 15th Ave
- 3717 15th Ave
- 3705 15th Ave
- 3802 Howard Ave
- 3723 15th Ave
- 3701 15th Ave
- 3711 Howard Ave
- 3713 Howard Ave
- 3707 Howard Ave
- 3721 Howard Ave
- 3801 15th Ave
- 3701 Howard Ave
- 3548 Howard Ave
- 3808 Howard Ave
- 3623 15th Ave
- 3807 15th Ave
- 3803 Howard Ave