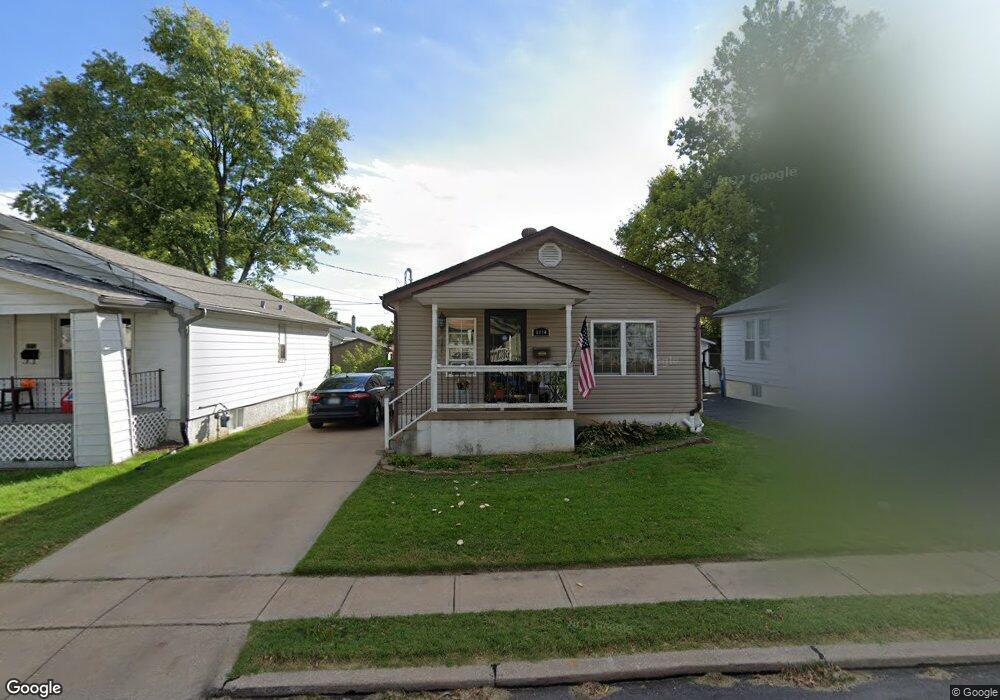
3714 Risch Ave Saint Louis, MO 63125
Lemay NeighborhoodEstimated Value: $164,251 - $248,000
2
Beds
2
Baths
816
Sq Ft
$231/Sq Ft
Est. Value
About This Home
This home is located at 3714 Risch Ave, Saint Louis, MO 63125 and is currently estimated at $188,313, approximately $230 per square foot. 3714 Risch Ave is a home located in St. Louis County with nearby schools including Hancock Place Elementary School, Hancock Place Middle School, and Hancock Place High School.
Ownership History
Date
Name
Owned For
Owner Type
Purchase Details
Closed on
Mar 18, 2011
Sold by
Muratovic Sadik and Muratovic Zija
Bought by
Jones Kimberly K
Current Estimated Value
Home Financials for this Owner
Home Financials are based on the most recent Mortgage that was taken out on this home.
Original Mortgage
$97,367
Outstanding Balance
$68,332
Interest Rate
5.25%
Mortgage Type
FHA
Estimated Equity
$119,981
Purchase Details
Closed on
Jun 23, 2010
Sold by
Federal National Mortgage Association
Bought by
Muratovic Sadik and Muratovic Zija
Purchase Details
Closed on
Oct 22, 2009
Sold by
Colburn Bobby L and Colburn Susan K
Bought by
Federal National Mortgage Association
Purchase Details
Closed on
Nov 29, 1997
Sold by
Colburn Bobby L and Walleman Susan K
Bought by
Colburn Bobby L and Colburn Susan K
Home Financials for this Owner
Home Financials are based on the most recent Mortgage that was taken out on this home.
Original Mortgage
$53,523
Interest Rate
7.3%
Mortgage Type
FHA
Create a Home Valuation Report for This Property
The Home Valuation Report is an in-depth analysis detailing your home's value as well as a comparison with similar homes in the area
Home Values in the Area
Average Home Value in this Area
Purchase History
| Date | Buyer | Sale Price | Title Company |
|---|---|---|---|
| Jones Kimberly K | $99,900 | Atc | |
| Muratovic Sadik | $30,000 | Continental Title Company | |
| Federal National Mortgage Association | $71,330 | None Available | |
| Colburn Bobby L | -- | -- |
Source: Public Records
Mortgage History
| Date | Status | Borrower | Loan Amount |
|---|---|---|---|
| Open | Jones Kimberly K | $97,367 | |
| Previous Owner | Colburn Bobby L | $53,523 |
Source: Public Records
Tax History
| Year | Tax Paid | Tax Assessment Tax Assessment Total Assessment is a certain percentage of the fair market value that is determined by local assessors to be the total taxable value of land and additions on the property. | Land | Improvement |
|---|---|---|---|---|
| 2025 | $2,175 | $30,820 | $11,460 | $19,360 |
| 2024 | $2,175 | $28,060 | $4,580 | $23,480 |
| 2023 | $2,065 | $28,060 | $4,580 | $23,480 |
| 2022 | $1,869 | $22,990 | $5,280 | $17,710 |
| 2021 | $1,837 | $22,990 | $5,280 | $17,710 |
| 2020 | $1,785 | $21,340 | $5,280 | $16,060 |
| 2019 | $1,780 | $21,340 | $5,280 | $16,060 |
| 2018 | $1,592 | $16,610 | $4,050 | $12,560 |
| 2017 | $1,564 | $16,610 | $4,050 | $12,560 |
| 2016 | $1,374 | $14,030 | $1,770 | $12,260 |
Source: Public Records
Map
Nearby Homes
- 707 Pardella Ave
- 619 Waller Ave
- 251 Wachtel Ave
- 252 Wachtel Ave
- 704 Dallas Dr
- 711 Erskine Ave
- 715 Erskine Ave
- 612 Horn Ave
- 235 Military Rd
- 705 Lagro Ave
- 607 Majesty Ct
- 334 Horn Ave
- 213 Waller Ave
- 816 Regina Ave
- 229 Horn Ave
- 424 Tiffany Dr
- 3720 Comstock Dr
- 4100 Whippoorwill Dr
- 210 Horn Ave
- 4107 Hummingbird Ct
- 3716 Risch Ave
- 3712 Risch Ave
- 3720 Risch Ave
- 3725 Viking Ave
- 3721 Viking Ave
- 3729 Viking Ave
- 3708 Risch Ave
- 3717 Viking Ave
- 3715 Risch Ave
- 3717 Risch Ave
- 3713 Viking Ave
- 3713 Risch Ave
- 3731 Viking Ave
- 3706 Risch Ave
- 3711 Risch Ave
- 3719 Risch Ave
- 3709 Viking Ave
- 3709 Risch Ave
- 3705 Viking Ave
- 604 Landor Ct
Your Personal Tour Guide
Ask me questions while you tour the home.