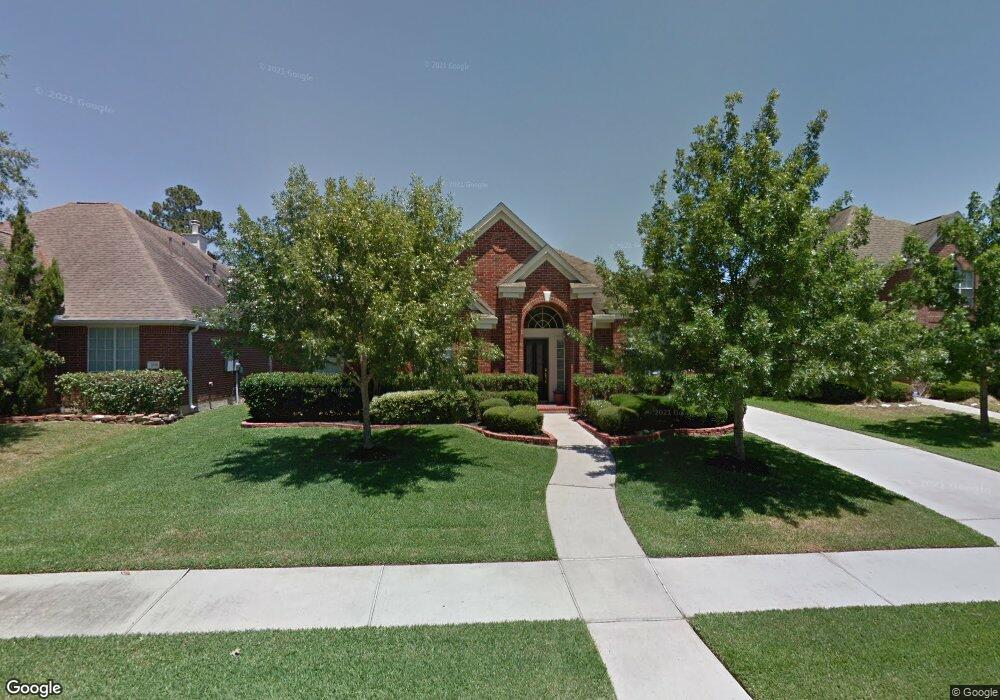
3714 Sapling Trail Ct Spring, TX 77388
Estimated Value: $320,066 - $338,000
4
Beds
2
Baths
2,278
Sq Ft
$144/Sq Ft
Est. Value
About This Home
This home is located at 3714 Sapling Trail Ct, Spring, TX 77388 and is currently estimated at $329,017, approximately $144 per square foot. 3714 Sapling Trail Ct is a home located in Harris County with nearby schools including Haude Elementary School, Strack Intermediate School, and Klein Collins High School.
Ownership History
Date
Name
Owned For
Owner Type
Purchase Details
Closed on
Feb 28, 2011
Sold by
Finnell Andrew Holland and Finnell Andrew Holland
Bought by
Teltschik Alfred and Teltschik Laura
Current Estimated Value
Purchase Details
Closed on
Aug 23, 2010
Sold by
Finnell Deborah Holder
Bought by
Finnell Andrew Holland
Purchase Details
Closed on
Jul 6, 2004
Sold by
Simmons Melissa
Bought by
Mortgage Electronic Registration Systems and Sterling Capital Mortgage Co
Purchase Details
Closed on
Jun 21, 2000
Sold by
Pulte Homes Of Texas Lp
Bought by
Finnell Andrew Holland and Finnell Deborah H
Home Financials for this Owner
Home Financials are based on the most recent Mortgage that was taken out on this home.
Original Mortgage
$144,400
Interest Rate
8.66%
Create a Home Valuation Report for This Property
The Home Valuation Report is an in-depth analysis detailing your home's value as well as a comparison with similar homes in the area
Purchase History
| Date | Buyer | Sale Price | Title Company |
|---|---|---|---|
| Teltschik Alfred | -- | First American Title | |
| Finnell Andrew Holland | -- | None Available | |
| Mortgage Electronic Registration Systems | $170,866 | -- | |
| Finnell Andrew Holland | -- | First American Title |
Source: Public Records
Mortgage History
| Date | Status | Borrower | Loan Amount |
|---|---|---|---|
| Previous Owner | Finnell Andrew Holland | $144,400 | |
| Closed | Finnell Andrew Holland | $0 |
Source: Public Records
Tax History
| Year | Tax Paid | Tax Assessment Tax Assessment Total Assessment is a certain percentage of the fair market value that is determined by local assessors to be the total taxable value of land and additions on the property. | Land | Improvement |
|---|---|---|---|---|
| 2025 | $1,809 | $293,781 | $59,378 | $234,403 |
| 2024 | $1,809 | $273,489 | $59,378 | $214,111 |
| 2023 | $1,809 | $335,437 | $59,378 | $276,059 |
| 2022 | $6,193 | $279,104 | $59,378 | $219,726 |
| 2021 | $6,051 | $231,012 | $42,588 | $188,424 |
| 2020 | $6,489 | $219,337 | $42,588 | $176,749 |
| 2019 | $6,404 | $207,589 | $42,588 | $165,001 |
| 2018 | $1,726 | $215,000 | $42,588 | $172,412 |
| 2017 | $6,682 | $215,000 | $42,588 | $172,412 |
| 2016 | $6,912 | $232,016 | $42,588 | $189,428 |
| 2015 | $3,713 | $217,845 | $42,588 | $175,257 |
| 2014 | $3,713 | $183,815 | $42,588 | $141,227 |
Source: Public Records
Map
Nearby Homes
- 3622 Chessnut Glen Dr
- 3522 Aspen Glen Ln
- 0 Kuykendahl Rd Unit 50148573
- 20518 Bonds Creek Ln
- 3510 Ash Glen Dr
- 20131 Forest Dr
- 20206 Treetop Ln
- 3618 Walnut Forest Ln
- 3610 Walnut Forest Ln
- 19402 Pine Lock Ln
- 19519 Piney Lake Dr
- 2518 Liguria Ln
- 2615 Liguria Ln
- 2615 Piemonte Avenue Cir
- 2523 Liguria
- 2603 Piemonte Ct Ave
- 20011 Rosswood Ln
- 19315 Puget Ln
- 19111 Applecrest Way
- 3607 Adamwood Ct
- 3710 Sapling Trail Ct
- 3718 Sapling Trail Ct
- 3711 Portside Dr
- 3707 Portside Dr
- 3715 Portside Dr
- 3706 Sapling Trail Ct
- 3715 Sapling Trail Ct
- 3719 Sapling Trail Ct
- 3703 Portside Dr
- 3802 Sapling Trail Ct
- 3702 Sapling Trail Ct
- 3707 Sapling Trail Ct
- 3803 Sapling Trail Ct
- 3806 Sapling Trail Ct
- 20502 Cypresswood Meadows Dr
- 3706 Tarawood Ct
- 3807 Portside Dr
- 3710 Tarawood Ct
- 3714 Tarawood Ct
- 3710 Portside Dr
Your Personal Tour Guide
Ask me questions while you tour the home.