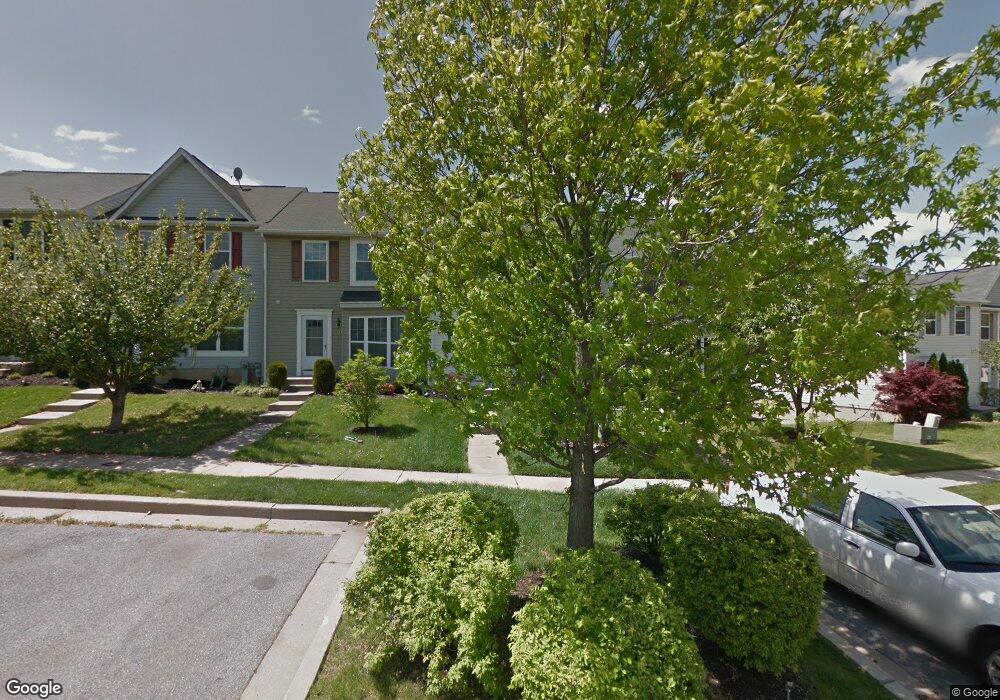
3714 Tall Grass Ct Randallstown, MD 21133
Estimated Value: $257,000 - $331,000
--
Bed
2
Baths
1,200
Sq Ft
$238/Sq Ft
Est. Value
About This Home
This home is located at 3714 Tall Grass Ct, Randallstown, MD 21133 and is currently estimated at $285,451, approximately $237 per square foot. 3714 Tall Grass Ct is a home located in Baltimore County with nearby schools including Randallstown Elementary School, Deer Park Middle Magnet School, and Randallstown High School.
Ownership History
Date
Name
Owned For
Owner Type
Purchase Details
Closed on
Sep 14, 2006
Sold by
Williams Telena R
Bought by
Williams Talena R
Current Estimated Value
Home Financials for this Owner
Home Financials are based on the most recent Mortgage that was taken out on this home.
Original Mortgage
$172,475
Outstanding Balance
$103,578
Interest Rate
6.67%
Mortgage Type
FHA
Estimated Equity
$181,873
Purchase Details
Closed on
Jul 7, 2006
Sold by
Williams Telena R
Bought by
Williams Talena R
Home Financials for this Owner
Home Financials are based on the most recent Mortgage that was taken out on this home.
Original Mortgage
$172,475
Interest Rate
6.67%
Mortgage Type
FHA
Purchase Details
Closed on
Jan 26, 2002
Sold by
Dorsey Alfonza James
Bought by
Williams Telena R
Purchase Details
Closed on
Aug 20, 1996
Sold by
Regional Homes Llc
Bought by
Dorsey Alfonza James and Dorsey Renee G
Create a Home Valuation Report for This Property
The Home Valuation Report is an in-depth analysis detailing your home's value as well as a comparison with similar homes in the area
Home Values in the Area
Average Home Value in this Area
Purchase History
| Date | Buyer | Sale Price | Title Company |
|---|---|---|---|
| Williams Talena R | -- | -- | |
| Williams Talena R | -- | -- | |
| Williams Telena R | $107,000 | -- | |
| Dorsey Alfonza James | $100,650 | -- |
Source: Public Records
Mortgage History
| Date | Status | Borrower | Loan Amount |
|---|---|---|---|
| Open | Williams Talena R | $172,475 | |
| Previous Owner | Williams Talena R | $172,475 |
Source: Public Records
Tax History Compared to Growth
Tax History
| Year | Tax Paid | Tax Assessment Tax Assessment Total Assessment is a certain percentage of the fair market value that is determined by local assessors to be the total taxable value of land and additions on the property. | Land | Improvement |
|---|---|---|---|---|
| 2025 | $3,010 | $225,967 | -- | -- |
| 2024 | $3,010 | $212,600 | $45,000 | $167,600 |
| 2023 | $1,468 | $206,033 | $0 | $0 |
| 2022 | $2,812 | $199,467 | $0 | $0 |
| 2021 | $2,703 | $192,900 | $45,000 | $147,900 |
| 2020 | $2,703 | $188,633 | $0 | $0 |
| 2019 | $2,771 | $184,367 | $0 | $0 |
| 2018 | $2,462 | $180,100 | $45,000 | $135,100 |
| 2017 | $2,317 | $164,000 | $0 | $0 |
| 2016 | $2,178 | $147,900 | $0 | $0 |
| 2015 | $2,178 | $131,800 | $0 | $0 |
| 2014 | $2,178 | $131,800 | $0 | $0 |
Source: Public Records
Map
Nearby Homes
- 9406 Painted Tree Dr
- 9401 Summer Squal Dr
- 9208A Liberty Rd
- 9210 Liberty Rd
- 9302 Silver Charm Dr
- 9202 Samoset Rd
- 3816 Cassandra Rd
- 3903 Red Deer Cir
- 4108 Brown Bark Cir
- 9519 Branchleigh Rd
- 9112 Meadow Heights Rd
- 3805 Terka Cir
- 3854 Terka Cir
- 9044 Allenswood Rd
- 3903 Innerdale Ct
- 4105 Hanwell Rd
- 3402 Offutt Rd
- 3332 Offutt Rd
- 3506 Bayer Ave
- 3705 Allenswood Ct
- 3712 Tall Grass Ct
- 3716 Tall Grass Ct
- 3710 Tall Grass Ct
- 3718 Tall Grass Ct
- 3708 Tall Grass Ct
- 9417 Joleon Rd
- 9415 Joleon Rd
- 3720 Tall Grass Ct
- 9413 Joleon Rd
- 3706 Tall Grass Ct
- 9419 Joleon Rd
- 9411 Joleon Rd
- 3722 Tall Grass Ct
- 9409 Joleon Rd
- 3704 Tall Grass Ct
- 9421 Joleon Rd
- 3702 Tall Grass Ct
- 9423 Joleon Rd
- 3724 Tall Grass Ct
- 9407 Joleon Rd