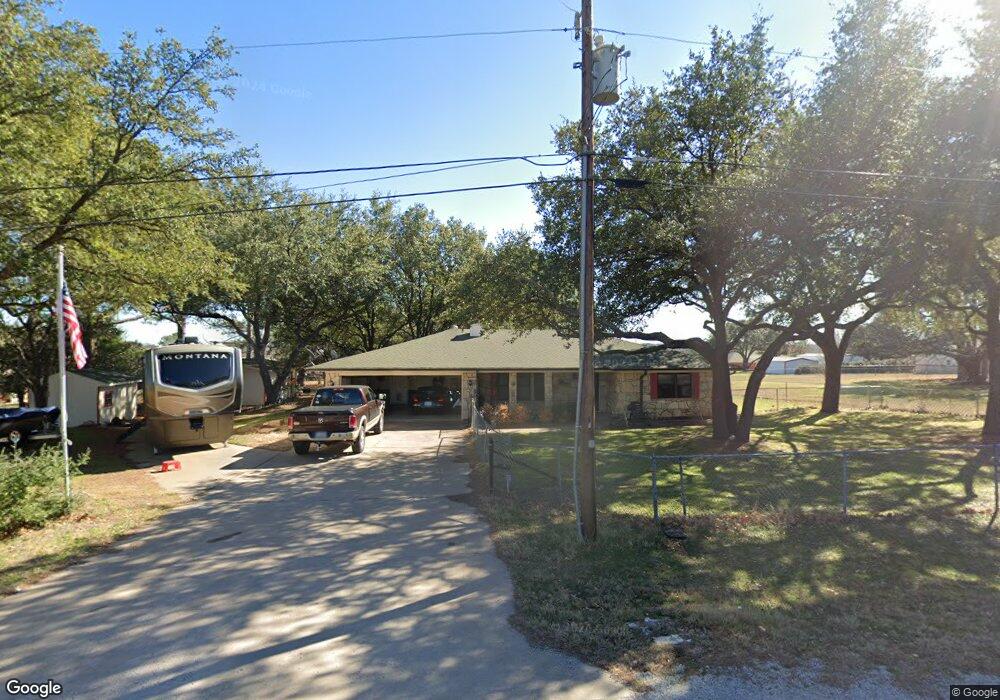
3715 Acorn Run Granbury, TX 76049
Estimated Value: $313,592 - $440,000
2
Beds
2
Baths
1,598
Sq Ft
$222/Sq Ft
Est. Value
About This Home
This home is located at 3715 Acorn Run, Granbury, TX 76049 and is currently estimated at $355,398, approximately $222 per square foot. 3715 Acorn Run is a home located in Hood County with nearby schools including Acton Elementary School, Acton Middle School, and Granbury High School.
Ownership History
Date
Name
Owned For
Owner Type
Purchase Details
Closed on
Apr 25, 2025
Sold by
Bushager Cecil Harold and Bushager Teresa Kay
Bought by
Bushager Cecil Harold and Bushager Teresa Kay
Current Estimated Value
Home Financials for this Owner
Home Financials are based on the most recent Mortgage that was taken out on this home.
Original Mortgage
$435,000
Outstanding Balance
$431,732
Interest Rate
3.8%
Mortgage Type
Reverse Mortgage Home Equity Conversion Mortgage
Estimated Equity
-$76,334
Purchase Details
Closed on
Dec 28, 2016
Sold by
Chastain Norma
Bought by
Bushager Cecil Harold
Purchase Details
Closed on
Jul 27, 2007
Sold by
Chastain Norma
Bought by
Chastain Norma
Purchase Details
Closed on
Jan 14, 2003
Sold by
Parks Family Trust
Bought by
Bushager Cecil Harold
Purchase Details
Closed on
Mar 10, 2000
Sold by
Fondy Robert J
Bought by
Bushager Cecil Harold
Purchase Details
Closed on
Feb 20, 1990
Bought by
Bushager Cecil Harold
Create a Home Valuation Report for This Property
The Home Valuation Report is an in-depth analysis detailing your home's value as well as a comparison with similar homes in the area
Home Values in the Area
Average Home Value in this Area
Purchase History
| Date | Buyer | Sale Price | Title Company |
|---|---|---|---|
| Bushager Cecil Harold | -- | None Listed On Document | |
| Bushager Cecil Harold | -- | -- | |
| Chastain Norma | -- | None Available | |
| Bushager Cecil Harold | -- | -- | |
| Bushager Cecil Harold | -- | -- | |
| Bushager Cecil Harold | -- | -- |
Source: Public Records
Mortgage History
| Date | Status | Borrower | Loan Amount |
|---|---|---|---|
| Open | Bushager Cecil Harold | $435,000 | |
| Closed | Bushager Cecil Harold | $435,000 |
Source: Public Records
Tax History Compared to Growth
Tax History
| Year | Tax Paid | Tax Assessment Tax Assessment Total Assessment is a certain percentage of the fair market value that is determined by local assessors to be the total taxable value of land and additions on the property. | Land | Improvement |
|---|---|---|---|---|
| 2025 | $363 | $278,687 | $60,000 | $246,580 |
| 2024 | $363 | $253,352 | $60,000 | $253,830 |
| 2023 | $2,803 | $284,710 | $60,000 | $224,710 |
| 2022 | $1,202 | $243,540 | $60,000 | $183,540 |
| 2021 | $2,922 | $216,420 | $20,000 | $196,420 |
| 2020 | $2,687 | $185,650 | $20,000 | $165,650 |
| 2019 | $2,557 | $164,040 | $20,000 | $144,040 |
| 2018 | $2,325 | $174,020 | $20,000 | $154,020 |
| 2017 | $2,174 | $130,010 | $10,000 | $120,010 |
| 2016 | $2,174 | $130,010 | $10,000 | $120,010 |
| 2015 | $709 | $123,840 | $10,000 | $113,840 |
| 2014 | $709 | $129,540 | $10,000 | $119,540 |
Source: Public Records
Map
Nearby Homes
- 3713 Indian Creek Trail
- 3711 Indian Creek Trail
- 3708 Coral Sands Ct
- 4309 Davis Rd
- 3711 Lonesome Creek Rd
- 4604 E Holiday Estates Ct
- 3521 Nassau Ct
- 4603 Rendezvous Ct
- 3710 Decordova Ranch Rd
- 3917 Decordova Ranch Rd
- 547 Tradition Way
- 4109 Newport Bay Ct
- 549 Tradition Way
- 4200 Bar Harbor Ct
- 3868 Legend Trail
- 3816 Winding Way
- 4415 Jackson Ln
- 3901 Upper Lake Cir
- 4306 Elmwood Ct
- 3809 Winding Way
- 3713 Acorn Run
- 4114 Arrowhead Ln
- 4116 Arrowhead Ln
- 3712 Indian Creek Trail
- 3711 Acorn Run
- 3714 Indian Creek Trail
- 3710 Indian Creek Trail
- 3716 Indian Creek Trail
- 3712 Acorn Run
- 4115 Arrowhead Ln
- 4113 Arrowhead Ln
- 3709 Acorn Run
- 4111 Arrowhead Ln
- 3708 Indian Creek Trail
- 3707 Acorn Run
- 3715 Indian Creek Trail
- 4109 Arrowhead Ln
- 3817 Quail Run
- 3801 Birdsong Ct
- 4200 Chaparral Ct