3715 Bentbill Crossing Unit 3715 Cumming, GA 30041
Big Creek NeighborhoodEstimated Value: $689,000 - $783,000
4
Beds
3
Baths
3,308
Sq Ft
$218/Sq Ft
Est. Value
About This Home
This home is located at 3715 Bentbill Crossing Unit 3715, Cumming, GA 30041 and is currently estimated at $721,633, approximately $218 per square foot. 3715 Bentbill Crossing Unit 3715 is a home located in Forsyth County with nearby schools including Brookwood Elementary School, South Forsyth Middle School, and Lambert High School.
Ownership History
Date
Name
Owned For
Owner Type
Purchase Details
Closed on
Aug 3, 2012
Sold by
Chitsazan Ehsan
Bought by
Brune John P
Current Estimated Value
Home Financials for this Owner
Home Financials are based on the most recent Mortgage that was taken out on this home.
Original Mortgage
$199,200
Outstanding Balance
$137,867
Interest Rate
3.65%
Mortgage Type
New Conventional
Estimated Equity
$583,766
Purchase Details
Closed on
Mar 12, 2010
Sold by
Cwalt Inc Trust 2006 & 18Cb
Bought by
Chitsazan Ehsan
Purchase Details
Closed on
Dec 1, 2009
Sold by
Cruz Esmerardo
Bought by
Cwalt Inc Trust 2006-18Cb
Purchase Details
Closed on
Mar 31, 2006
Sold by
Ryland Group Inc
Bought by
Cruz Esmerardo and Garcia Nancy
Home Financials for this Owner
Home Financials are based on the most recent Mortgage that was taken out on this home.
Original Mortgage
$239,020
Interest Rate
6.23%
Mortgage Type
New Conventional
Create a Home Valuation Report for This Property
The Home Valuation Report is an in-depth analysis detailing your home's value as well as a comparison with similar homes in the area
Home Values in the Area
Average Home Value in this Area
Purchase History
| Date | Buyer | Sale Price | Title Company |
|---|---|---|---|
| Brune John P | $249,000 | -- | |
| Chitsazan Ehsan | $230,000 | -- | |
| Cwalt Inc Trust 2006-18Cb | $208,800 | -- | |
| Cruz Esmerardo | $298,500 | -- |
Source: Public Records
Mortgage History
| Date | Status | Borrower | Loan Amount |
|---|---|---|---|
| Open | Brune John P | $199,200 | |
| Previous Owner | Cruz Esmerardo | $239,020 |
Source: Public Records
Tax History Compared to Growth
Tax History
| Year | Tax Paid | Tax Assessment Tax Assessment Total Assessment is a certain percentage of the fair market value that is determined by local assessors to be the total taxable value of land and additions on the property. | Land | Improvement |
|---|---|---|---|---|
| 2025 | $4,985 | $276,836 | $78,000 | $198,836 |
| 2024 | $4,985 | $248,608 | $66,000 | $182,608 |
| 2023 | $4,491 | $239,260 | $62,000 | $177,260 |
| 2022 | $4,436 | $153,872 | $56,000 | $97,872 |
| 2021 | $3,842 | $153,872 | $56,000 | $97,872 |
| 2020 | $3,859 | $154,684 | $56,000 | $98,684 |
| 2019 | $3,741 | $148,692 | $56,000 | $92,692 |
| 2018 | $3,695 | $145,704 | $32,000 | $113,704 |
| 2017 | $3,508 | $136,132 | $26,000 | $110,132 |
| 2016 | $3,260 | $124,412 | $26,000 | $98,412 |
| 2015 | $3,096 | $116,372 | $26,000 | $90,372 |
| 2014 | $2,871 | $108,464 | $26,000 | $82,464 |
Source: Public Records
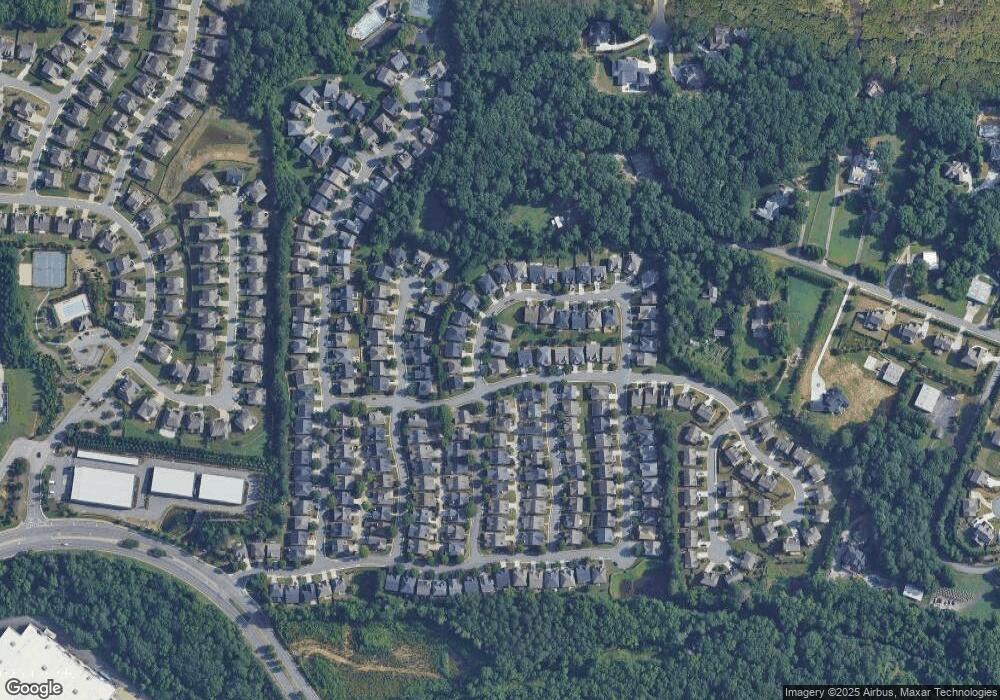
Map
Nearby Homes
- 2940 Bentbill Crossing
- 3440 Commander Cove
- 3470 Commander Cove
- 3485 Vermillion View
- 3430 Commander Cove
- 3510 Vermillion View
- 2850 Brandy Ln
- 2530 Thackery Ct
- 2380 Manor Creek Ct
- 2690 Portabella Ln
- 2530 Gold Creek Ln
- 335 Pintail Ct
- 2310 Callaway Ct
- 3440 Ronnie Ln
- 3150 Thistle Trail
- 3115 Arbor Song Ct
- 3250 Caney Estates Place
- 6505 Caldwell Ct
- 5625 Buckleigh Pointe
- 355 Laurel Oak Dr
- 3715 Bentbill Crossing
- 3715 Bentbill Crossing Unit 2
- 3735 Bentbill Crossing Unit 2
- 3695 Bentbill Crossing
- 3695 Bentbill Crossing Unit 3695
- 3325 Kissell Dr
- 3335 Kissell Dr
- 3720 Bentbill Crossing Unit 2
- 3645 Bentbill Crossing Unit 2
- 3710 Bentbill Crossing
- 3730 Bentbill Crossing Unit 82
- 3730 Bentbill Crossing
- 3730 Bentbill Crossing
- 3690 Bentbill Crossing Unit 2
- 3415 Tanager Ct
- 3290 Brown Thrasher Trace
- 3740 Bentbill Crossing
- 3635 Bentbill Crossing Unit 2
- 3680 Bentbill Crossing Unit 2
- 3405 Kissell Dr Unit 2