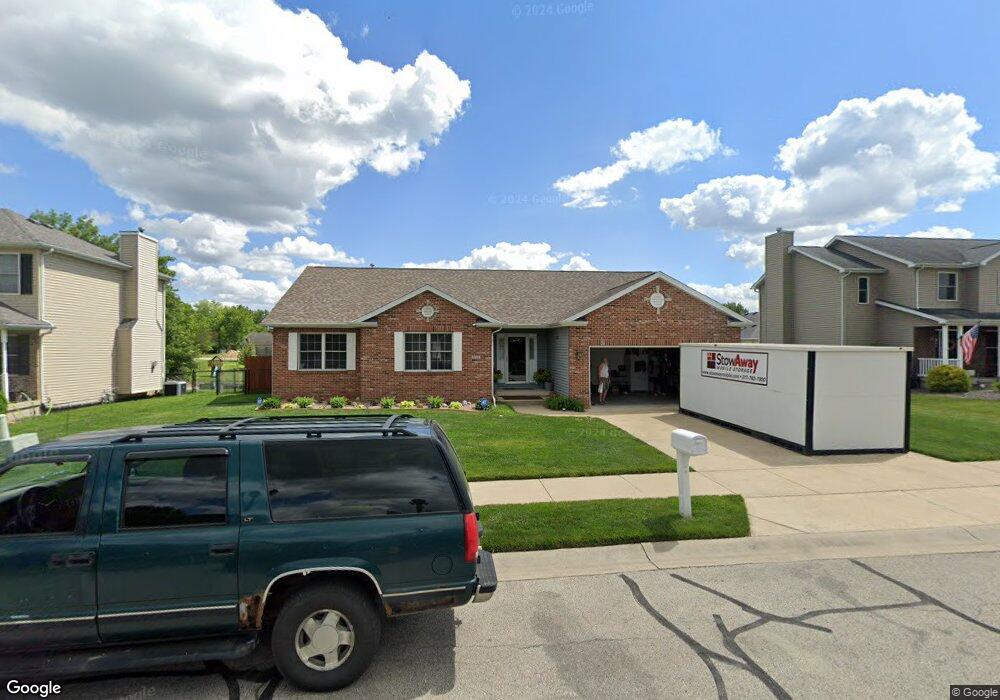
3715 Sydney Ct Decatur, IL 62521
Greenlake NeighborhoodEstimated Value: $286,000 - $317,000
3
Beds
3
Baths
3,492
Sq Ft
$85/Sq Ft
Est. Value
About This Home
This home is located at 3715 Sydney Ct, Decatur, IL 62521 and is currently estimated at $297,455, approximately $85 per square foot. 3715 Sydney Ct is a home located in Macon County with nearby schools including McGaughey Elementary School, Mt. Zion Elementary School, and Mt. Zion Intermediate School.
Ownership History
Date
Name
Owned For
Owner Type
Purchase Details
Closed on
Jul 25, 2022
Sold by
Stukins Lea R
Bought by
Watkins Terry and Watkins Nadine
Current Estimated Value
Home Financials for this Owner
Home Financials are based on the most recent Mortgage that was taken out on this home.
Original Mortgage
$197,200
Outstanding Balance
$188,686
Interest Rate
5.78%
Mortgage Type
New Conventional
Estimated Equity
$108,769
Purchase Details
Closed on
May 26, 2022
Sold by
Cycotte Joseph D
Bought by
Stukins Lea R
Home Financials for this Owner
Home Financials are based on the most recent Mortgage that was taken out on this home.
Original Mortgage
$197,200
Outstanding Balance
$188,686
Interest Rate
5.78%
Mortgage Type
New Conventional
Estimated Equity
$108,769
Purchase Details
Closed on
Aug 1, 2005
Sold by
Clearwater Shores Development Llc
Bought by
Cycotte Joseph D and Cycotte Karen S
Home Financials for this Owner
Home Financials are based on the most recent Mortgage that was taken out on this home.
Original Mortgage
$198,300
Interest Rate
5.66%
Mortgage Type
Construction
Create a Home Valuation Report for This Property
The Home Valuation Report is an in-depth analysis detailing your home's value as well as a comparison with similar homes in the area
Home Values in the Area
Average Home Value in this Area
Purchase History
| Date | Buyer | Sale Price | Title Company |
|---|---|---|---|
| Watkins Terry | $246,500 | Chiligiris Andrew P | |
| Watkins Terry | $246,500 | Chiligiris Andrew P | |
| Stukins Lea R | $198,000 | Chiligiris Andrew P | |
| Cycotte Joseph D | $34,500 | None Available |
Source: Public Records
Mortgage History
| Date | Status | Borrower | Loan Amount |
|---|---|---|---|
| Open | Watkins Terry | $197,200 | |
| Closed | Watkins Terry | $197,200 | |
| Previous Owner | Cycotte Joseph D | $198,300 |
Source: Public Records
Tax History Compared to Growth
Tax History
| Year | Tax Paid | Tax Assessment Tax Assessment Total Assessment is a certain percentage of the fair market value that is determined by local assessors to be the total taxable value of land and additions on the property. | Land | Improvement |
|---|---|---|---|---|
| 2024 | $6,679 | $84,916 | $14,350 | $70,566 |
| 2023 | $6,370 | $78,904 | $13,334 | $65,570 |
| 2022 | $6,285 | $74,190 | $12,538 | $61,652 |
| 2021 | $6,305 | $70,334 | $11,886 | $58,448 |
| 2020 | $6,077 | $67,220 | $11,360 | $55,860 |
| 2019 | $6,077 | $67,220 | $11,360 | $55,860 |
| 2018 | $5,875 | $65,747 | $11,111 | $54,636 |
| 2017 | $5,822 | $64,935 | $10,974 | $53,961 |
| 2016 | $6,518 | $71,862 | $10,967 | $60,895 |
| 2015 | $6,317 | $70,940 | $10,826 | $60,114 |
| 2014 | $6,032 | $70,940 | $10,826 | $60,114 |
| 2013 | $6,060 | $70,940 | $10,826 | $60,114 |
Source: Public Records
Map
Nearby Homes
- 2488 S Fontaine Dr
- 2554 S Nantucket Dr
- 2504 S Nantucket Dr
- 2571 Lansdowne Dr
- 2458 Quail Dr
- 3405 Fontenac Ct
- 3290 E Fitzgerald Rd
- 3172 Redlich Dr
- 3552 E Orchard Dr
- 3210 Fields Ct
- 1968 S Baltimore Ave
- 3330 S Baltimore Ave
- 3109 E Cherry Dr
- 1748 S Montrose Ave
- 3645 E Fulton Ave
- 1745 S 44th St
- 4090 S Lake Ct
- 1715 S 34th Place
- 1809 S 32nd St
- 3254 E Fulton Ave
- 3735 Sydney Ct
- 3685 Sydney Ct
- LOT 14 Sydney Ct
- LOT 13 Sydney Ct
- 2556 Rachels Way
- 3755 Sydney Ct
- 3710 Sydney Ct
- 3730 Sydney Ct
- 2566 Rachels Way
- 3680 Sydney Ct
- 3710 Redlich Dr
- 3730 Redlich Dr
- 3680 Redlich Dr
- 3707 Fontenac Dr
- 2535 Rachels Way
- 3660 Sydney Ct
- 3681 Fontenac Dr
- 2555 Rachels Way
- 2555 Rachel's Way
- 3770 Sydney Ct