Estimated Value: $505,000 - $540,000
4
Beds
3
Baths
2,450
Sq Ft
$211/Sq Ft
Est. Value
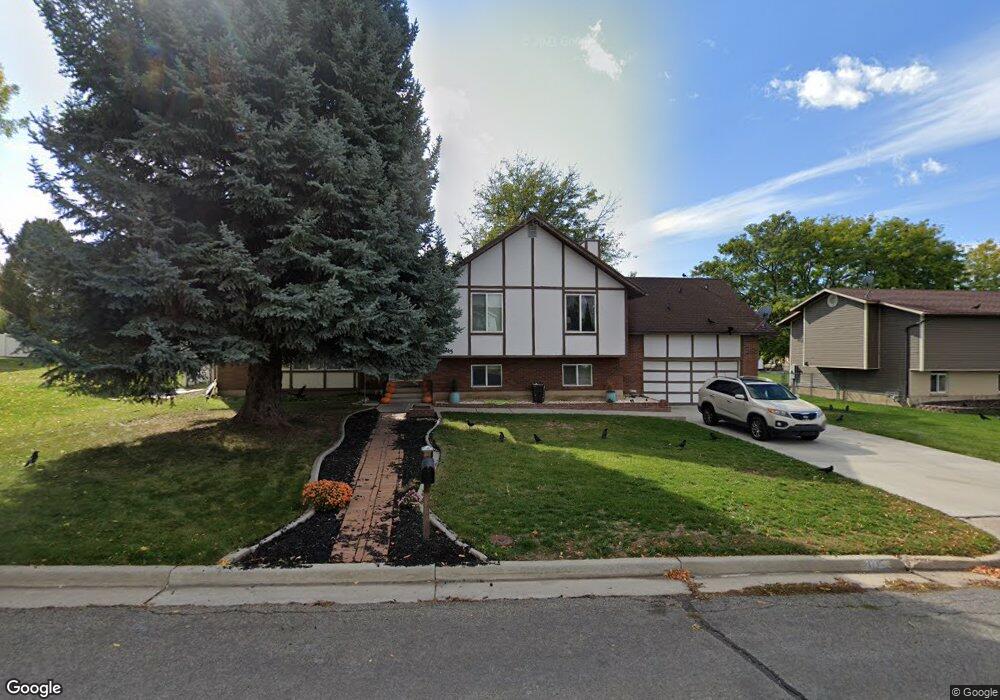
About This Home
This home is located at 3715 W 5850 S, Roy, UT 84067 and is currently estimated at $516,954, approximately $211 per square foot. 3715 W 5850 S is a home located in Weber County with nearby schools including Freedom School, Roy Junior High School, and Roy High School.
Ownership History
Date
Name
Owned For
Owner Type
Purchase Details
Closed on
Jul 9, 2021
Sold by
York James and Nalder Angela L
Bought by
Smith Wyman Ollie Joe and Marquez Jessica
Current Estimated Value
Home Financials for this Owner
Home Financials are based on the most recent Mortgage that was taken out on this home.
Original Mortgage
$200,000
Outstanding Balance
$181,469
Interest Rate
2.9%
Mortgage Type
New Conventional
Estimated Equity
$335,485
Purchase Details
Closed on
Jun 22, 2013
Sold by
Burgon Elaina
Bought by
York James and Nalder Angela L
Home Financials for this Owner
Home Financials are based on the most recent Mortgage that was taken out on this home.
Original Mortgage
$176,739
Interest Rate
3.5%
Mortgage Type
FHA
Create a Home Valuation Report for This Property
The Home Valuation Report is an in-depth analysis detailing your home's value as well as a comparison with similar homes in the area
Home Values in the Area
Average Home Value in this Area
Purchase History
| Date | Buyer | Sale Price | Title Company |
|---|---|---|---|
| Smith Wyman Ollie Joe | -- | Real Advantage Title Ins | |
| York James | -- | Eagle Pointe Title Ins Agen |
Source: Public Records
Mortgage History
| Date | Status | Borrower | Loan Amount |
|---|---|---|---|
| Open | Smith Wyman Ollie Joe | $200,000 | |
| Previous Owner | York James | $176,739 |
Source: Public Records
Tax History
| Year | Tax Paid | Tax Assessment Tax Assessment Total Assessment is a certain percentage of the fair market value that is determined by local assessors to be the total taxable value of land and additions on the property. | Land | Improvement |
|---|---|---|---|---|
| 2025 | $3,045 | $480,040 | $149,080 | $330,960 |
| 2024 | $2,970 | $260,849 | $82,011 | $178,838 |
| 2023 | $2,707 | $236,543 | $81,968 | $154,575 |
| 2022 | $2,886 | $259,050 | $68,415 | $190,635 |
| 2021 | $2,601 | $386,000 | $84,566 | $301,434 |
| 2020 | $2,316 | $316,000 | $84,566 | $231,434 |
| 2019 | $2,302 | $297,000 | $54,729 | $242,271 |
| 2018 | $2,113 | $256,000 | $49,724 | $206,276 |
| 2017 | $1,824 | $205,000 | $44,698 | $160,302 |
| 2016 | $1,768 | $107,163 | $24,537 | $82,626 |
| 2015 | $1,577 | $97,280 | $21,792 | $75,488 |
| 2014 | $1,553 | $94,798 | $21,792 | $73,006 |
Source: Public Records
Map
Nearby Homes
- 5854 S 3500 W
- 2216 W 2615 N Unit 142
- 2208 W 2615 N
- 2208 W 2615 N Unit 141
- 2186 W 2615 N
- 2186 W 2615 N Unit 139
- 2606 N 2125 W
- 2606 N 2125 W Unit 149
- 2602 N 2125 W
- 2602 N 2125 W Unit 150
- 2596 N 2125 W Unit 151
- 2596 N 2125 W
- 2657 N 2000 W
- 2566 N 2125 W
- 2593 N 2000 W
- 4062 W 5950 S
- 5791 S 3260 W
- 4144 W 6075 S
- 5999 S 3200 W
- 4239 W 5825 S
Your Personal Tour Guide
Ask me questions while you tour the home.