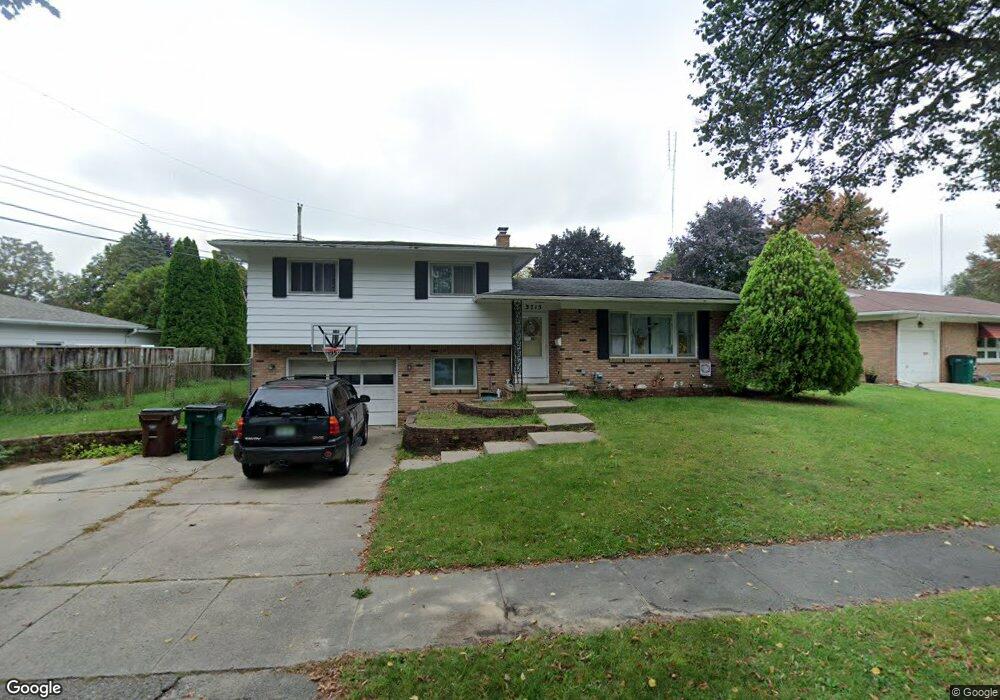
3715 Weger Place Lansing, MI 48910
Old Everett NeighborhoodEstimated Value: $161,000 - $205,793
3
Beds
2
Baths
1,334
Sq Ft
$140/Sq Ft
Est. Value
About This Home
This home is located at 3715 Weger Place, Lansing, MI 48910 and is currently estimated at $186,448, approximately $139 per square foot. 3715 Weger Place is a home located in Ingham County with nearby schools including Kendon School, Attwood School, and Everett High School.
Ownership History
Date
Name
Owned For
Owner Type
Purchase Details
Closed on
Jan 29, 2009
Sold by
Gatica Hector and Gatica Rosaena
Bought by
Hsbc Bank Usa National Association
Current Estimated Value
Purchase Details
Closed on
Nov 9, 2005
Sold by
Smith Gerald L and Smith Helen J
Bought by
Gatica Hector and Gatica Rosaena
Home Financials for this Owner
Home Financials are based on the most recent Mortgage that was taken out on this home.
Original Mortgage
$120,700
Interest Rate
6.17%
Mortgage Type
Fannie Mae Freddie Mac
Create a Home Valuation Report for This Property
The Home Valuation Report is an in-depth analysis detailing your home's value as well as a comparison with similar homes in the area
Home Values in the Area
Average Home Value in this Area
Purchase History
| Date | Buyer | Sale Price | Title Company |
|---|---|---|---|
| Hsbc Bank Usa National Association | $48,000 | None Available | |
| Gatica Hector | $142,000 | None Available |
Source: Public Records
Mortgage History
| Date | Status | Borrower | Loan Amount |
|---|---|---|---|
| Previous Owner | Gatica Hector | $120,700 |
Source: Public Records
Tax History Compared to Growth
Tax History
| Year | Tax Paid | Tax Assessment Tax Assessment Total Assessment is a certain percentage of the fair market value that is determined by local assessors to be the total taxable value of land and additions on the property. | Land | Improvement |
|---|---|---|---|---|
| 2025 | $3,242 | $99,400 | $12,100 | $87,300 |
| 2024 | $26 | $84,000 | $12,100 | $71,900 |
| 2023 | $3,040 | $70,100 | $12,100 | $58,000 |
| 2022 | $2,740 | $61,100 | $11,000 | $50,100 |
| 2021 | $2,683 | $55,900 | $5,500 | $50,400 |
| 2020 | $2,666 | $54,000 | $5,500 | $48,500 |
| 2019 | $2,556 | $48,300 | $5,500 | $42,800 |
| 2018 | $2,395 | $41,700 | $5,500 | $36,200 |
| 2017 | $2,293 | $41,700 | $5,500 | $36,200 |
| 2016 | $2,232 | $41,000 | $5,500 | $35,500 |
| 2015 | $2,232 | $39,600 | $10,946 | $28,654 |
| 2014 | $2,232 | $39,700 | $9,180 | $30,520 |
Source: Public Records
Map
Nearby Homes
- 3801 Schlee St
- 3820 Lowcroft Ave
- 3430 Palmer St
- 3705 Burchfield Dr
- 4004 Lowcroft Ave
- 0 Burchfield Dr
- 4125 Lowcroft Ave
- 600 W Cavanaugh Rd
- 715 W Holmes Rd
- 3322 Palmer St
- 416 W Holmes Rd
- 4114 Burchfield Dr
- 4022 Stabler St
- 3801 Stabler St
- 4407 Burchfield Ave
- 100 Fenton St
- 0 Eaton Ct
- 201 W Graham Ave
- 4221 S Martin Luther King Junior Blvd
- 1113 Eaton Ct
- 3723 Weger Place
- 3800 Palmer St
- 3701 Weger Place
- 3808 Palmer St
- 3801 Weger Place
- 3724 Weger Plc
- 3712 Weger Place
- 3718 Weger Place
- 3706 Weger Place
- 3814 Palmer St
- 3724 Weger Place
- 3817 Weger Place
- 3709 Palmer St
- 3800 Weger Place
- 3701 Palmer St
- 3801 Palmer St
- 3820 Palmer St
- 3633 Palmer St
- 3811 Palmer St