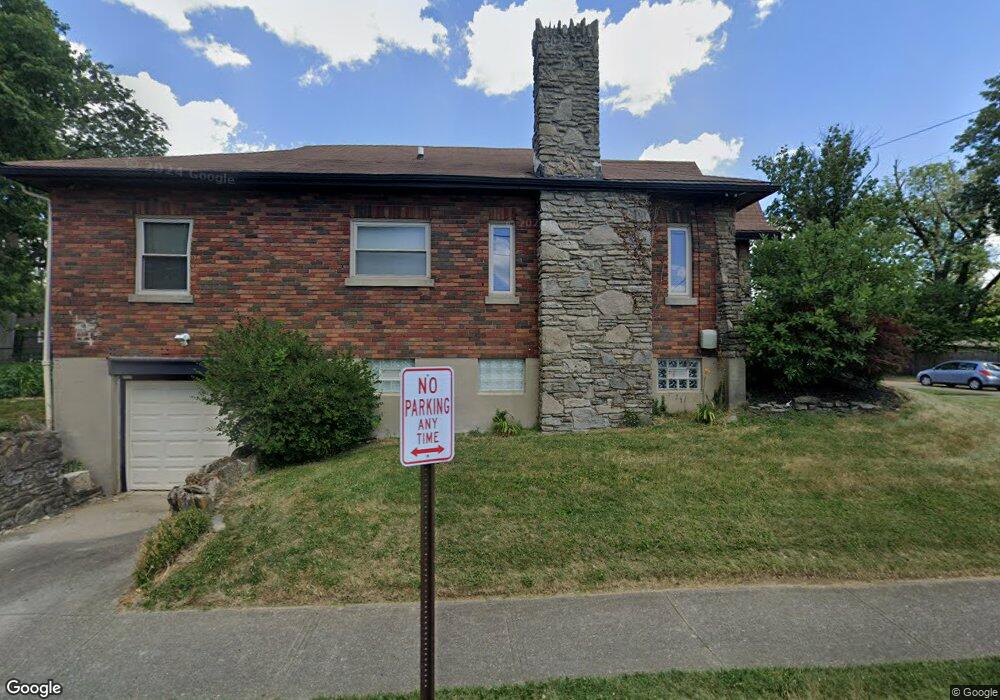
3716 Homelawn Ave Cincinnati, OH 45211
Estimated Value: $167,911 - $194,000
2
Beds
2
Baths
1,314
Sq Ft
$138/Sq Ft
Est. Value
About This Home
This home is located at 3716 Homelawn Ave, Cincinnati, OH 45211 and is currently estimated at $181,728, approximately $138 per square foot. 3716 Homelawn Ave is a home located in Hamilton County with nearby schools including Cheviot Elementary School, Western Hills High School, and Gilbert A. Dater High School.
Ownership History
Date
Name
Owned For
Owner Type
Purchase Details
Closed on
Mar 31, 2011
Sold by
Roemer Susan C
Bought by
Johnson Samuel R
Current Estimated Value
Home Financials for this Owner
Home Financials are based on the most recent Mortgage that was taken out on this home.
Original Mortgage
$77,265
Outstanding Balance
$53,480
Interest Rate
4.87%
Mortgage Type
FHA
Estimated Equity
$128,248
Purchase Details
Closed on
Mar 15, 1998
Sold by
Stevens John O
Bought by
Roemer Susan C
Home Financials for this Owner
Home Financials are based on the most recent Mortgage that was taken out on this home.
Original Mortgage
$69,250
Interest Rate
7.15%
Purchase Details
Closed on
Mar 12, 1998
Sold by
Wilhelm Marie Stevens and Stevens Charlotte M
Bought by
Roemer Susan C
Home Financials for this Owner
Home Financials are based on the most recent Mortgage that was taken out on this home.
Original Mortgage
$69,250
Interest Rate
7.15%
Create a Home Valuation Report for This Property
The Home Valuation Report is an in-depth analysis detailing your home's value as well as a comparison with similar homes in the area
Home Values in the Area
Average Home Value in this Area
Purchase History
| Date | Buyer | Sale Price | Title Company |
|---|---|---|---|
| Johnson Samuel R | $85,000 | Attorney | |
| Roemer Susan C | -- | -- | |
| Roemer Susan C | $72,900 | -- |
Source: Public Records
Mortgage History
| Date | Status | Borrower | Loan Amount |
|---|---|---|---|
| Open | Johnson Samuel R | $77,265 | |
| Previous Owner | Roemer Susan C | $69,250 |
Source: Public Records
Tax History Compared to Growth
Tax History
| Year | Tax Paid | Tax Assessment Tax Assessment Total Assessment is a certain percentage of the fair market value that is determined by local assessors to be the total taxable value of land and additions on the property. | Land | Improvement |
|---|---|---|---|---|
| 2024 | $2,443 | $40,331 | $6,745 | $33,586 |
| 2023 | $2,494 | $40,331 | $6,745 | $33,586 |
| 2022 | $1,934 | $27,073 | $5,838 | $21,235 |
| 2021 | $1,885 | $27,073 | $5,838 | $21,235 |
| 2020 | $1,914 | $27,073 | $5,838 | $21,235 |
| 2019 | $1,884 | $23,958 | $5,166 | $18,792 |
| 2018 | $1,886 | $23,958 | $5,166 | $18,792 |
| 2017 | $1,803 | $23,958 | $5,166 | $18,792 |
| 2016 | $2,349 | $30,643 | $5,320 | $25,323 |
| 2015 | $2,134 | $30,643 | $5,320 | $25,323 |
| 2014 | $2,085 | $30,643 | $5,320 | $25,323 |
| 2013 | $2,054 | $29,750 | $5,166 | $24,584 |
Source: Public Records
Map
Nearby Homes
- 4104 Trevor Ave
- 4001 Lovell Ave
- 4038 Washington Ave
- 3640 Westwood Northern Blvd
- 3997 Washington Ave
- 3982 Davis Ave
- 4031 Homelawn Ave
- 3608 Westwood Northern Blvd
- 3935 Lovell Ave
- 0 Westwood Northern Blvd Unit 1851736
- 3594 Homelawn Ave
- 4117 N Bend Rd Unit 8
- 4117 N Bend Rd
- 3502 Woodbine Ave
- 3325 Camvic Terrace
- 3832 Lovell Ave
- 3774 Ridgewood Ave
- 3853 Delmar Ave
- 3968 Kenkel Ave
- 3842 Delmar Ave
- 3714 Homelawn Ave
- 3712 Homelawn Ave
- 4016 Trevor Ave
- 4020 Trevor Ave
- 4011 Trevor Ave
- 3710 Homelawn Ave
- 4005 Trevor Ave
- 3996 Trevor Ave
- 4013 Trevor Ave
- 3651 Puhlman Ave
- 4024 Trevor Ave
- 3706 Homelawn Ave
- 3647 Puhlman Ave
- 3995 Trevor Ave
- 4019 Trevor Ave
- 3992 Trevor Ave
- 3645 Puhlman Ave
- 3705 Homelawn Ave
- 3702 Homelawn Ave
- 3991 Trevor Ave