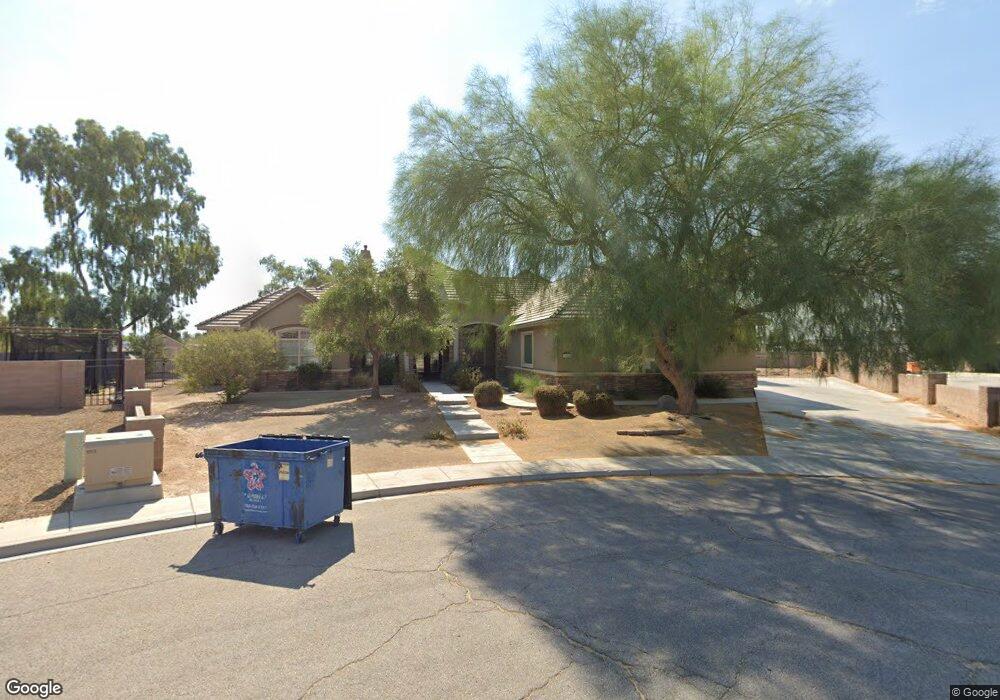
3716 Mahalo Cir Logandale, NV 89021
Estimated Value: $729,816 - $842,000
3
Beds
4
Baths
3,579
Sq Ft
$219/Sq Ft
Est. Value
About This Home
This home is located at 3716 Mahalo Cir, Logandale, NV 89021 and is currently estimated at $785,204, approximately $219 per square foot. 3716 Mahalo Cir is a home with nearby schools including Grant Bowler Elementary School, Mack Lyon Middle School, and Moapa Valley High School.
Ownership History
Date
Name
Owned For
Owner Type
Purchase Details
Closed on
May 1, 2025
Sold by
Billingsley Gary and Billingsley Terri
Bought by
Gary And Terri Billingsley Family Trust and Billingsley
Current Estimated Value
Purchase Details
Closed on
Jul 25, 2005
Sold by
Katterhagen Lyle A and Katterhagen Lacinda
Bought by
Billingsley Gary and Billingsley Terri
Purchase Details
Closed on
Sep 20, 2004
Sold by
Pulsipher Charles S and Pulsipher Paula M
Bought by
Katterhagen Lyle A and Katterhagen Lacinda
Purchase Details
Closed on
May 26, 2003
Sold by
Wollenzien Barry D and Wollenzien Nancy
Bought by
Pulsipher Charles E and Pulsipher Paula M
Purchase Details
Closed on
Jul 25, 1997
Sold by
Wollenzien John C and Wollenzien Donna J
Bought by
Wollenzien Barry D and Wollenzien Nancy
Create a Home Valuation Report for This Property
The Home Valuation Report is an in-depth analysis detailing your home's value as well as a comparison with similar homes in the area
Home Values in the Area
Average Home Value in this Area
Purchase History
| Date | Buyer | Sale Price | Title Company |
|---|---|---|---|
| Gary And Terri Billingsley Family Trust | -- | None Listed On Document | |
| Billingsley Gary | $170,000 | Nevada Title Company | |
| Katterhagen Lyle A | $110,000 | Nevada Title Company | |
| Pulsipher Charles E | $37,000 | Nevada Title Company | |
| Wollenzien Barry D | $31,500 | Fidelity National Title Co |
Source: Public Records
Tax History Compared to Growth
Tax History
| Year | Tax Paid | Tax Assessment Tax Assessment Total Assessment is a certain percentage of the fair market value that is determined by local assessors to be the total taxable value of land and additions on the property. | Land | Improvement |
|---|---|---|---|---|
| 2025 | $3,130 | $284,885 | $25,725 | $259,160 |
| 2024 | $3,040 | $284,885 | $25,725 | $259,160 |
| 2023 | $3,040 | $264,671 | $22,050 | $242,621 |
| 2022 | $2,952 | $227,659 | $18,375 | $209,284 |
| 2021 | $2,867 | $216,650 | $16,538 | $200,112 |
| 2020 | $2,760 | $214,234 | $16,538 | $197,696 |
| 2019 | $2,680 | $199,773 | $15,435 | $184,338 |
| 2018 | $2,601 | $192,329 | $15,068 | $177,261 |
| 2017 | $4,860 | $192,346 | $12,128 | $180,218 |
| 2016 | $2,486 | $157,864 | $9,188 | $148,676 |
| 2015 | $2,521 | $129,567 | $9,188 | $120,379 |
| 2014 | -- | $124,107 | $9,188 | $114,919 |
Source: Public Records
Map
Nearby Homes
- 2025 Whipple Ave
- 1951 Jim Haworth Ct
- 0 Unit 2676698
- 3765 Berkeley St
- 0 Moapa Valley Unit 2721305
- 3728 River Heights Ln
- 1593 Valley Home Ct
- 0 Paiute St
- 1998 Whitneys Dream Ave
- 4045 River Heights Ln
- 4135 Sandy St
- 1604 Heights Dr
- 1573 Heights Dr
- 1525 Heights Dr
- 3811 Skyline St
- 1990 Liston Ave
- 0 Skyline St
- 2925 Rice St
- 1140 Mahoney Ave
- 1141 Thomas Bay Cir
- 3722 Mahalo Cir
- 3710 Mahalo Cir
- 3709 Mahalo Cir
- 3728 Mahalo Cir
- 1965 Whipple Ave
- 3741 Mahalo Cir
- 3747 Mahalo Cir
- 3645 N Moapa Valley Blvd
- 3764 Mahalo Cir
- 3703 Mahalo Cir
- 0 Mahalo Cir
- 3794 Mahalo Cir
- 3753 Mahalo Cir
- 3746 Mahalo Cir
- 2029 Whipple Ave
- 3788 Mahalo Cir
- 1971 Jim Haworth Ct
- 3759 Mahalo Cir
- 1991 Jim Haworth Ct
- 3752 Mahalo Cir