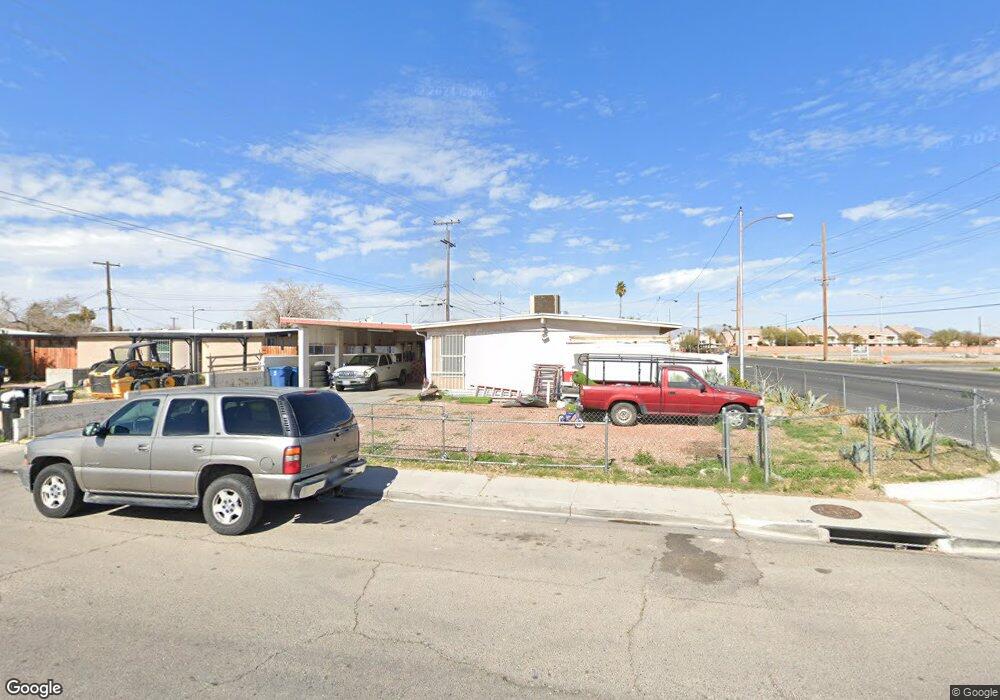
3716 Reynolds Ave North Las Vegas, NV 89030
Downtown North Las Vegas NeighborhoodEstimated Value: $306,023 - $358,000
3
Beds
2
Baths
1,161
Sq Ft
$279/Sq Ft
Est. Value
About This Home
This home is located at 3716 Reynolds Ave, North Las Vegas, NV 89030 and is currently estimated at $324,006, approximately $279 per square foot. 3716 Reynolds Ave is a home located in Clark County with nearby schools including Tom Williams Elementary School, J.D. Smith Middle School, and Desert Pines High School.
Ownership History
Date
Name
Owned For
Owner Type
Purchase Details
Closed on
Mar 25, 2016
Sold by
Parayo Penafrancia P and Parayo Edward
Bought by
Martin Antonio and Martin Ana Martin
Current Estimated Value
Purchase Details
Closed on
Oct 21, 2007
Sold by
Parayo Penafrancia P and Parayo Edward
Bought by
Parayo Penafrancia P and Parayo Edward
Home Financials for this Owner
Home Financials are based on the most recent Mortgage that was taken out on this home.
Original Mortgage
$70,000
Interest Rate
6.36%
Mortgage Type
Credit Line Revolving
Purchase Details
Closed on
Jun 27, 2001
Sold by
Parayo Edward D and Parayo Penafrancia
Bought by
Parayo Edward and Parayo Penafrancia
Home Financials for this Owner
Home Financials are based on the most recent Mortgage that was taken out on this home.
Original Mortgage
$61,800
Interest Rate
7.24%
Create a Home Valuation Report for This Property
The Home Valuation Report is an in-depth analysis detailing your home's value as well as a comparison with similar homes in the area
Home Values in the Area
Average Home Value in this Area
Purchase History
| Date | Buyer | Sale Price | Title Company |
|---|---|---|---|
| Martin Antonio | $85,000 | Chicago Title Las Vegas | |
| Parayo Penafrancia P | -- | Chicago Title | |
| Parayo Edward | -- | United Title |
Source: Public Records
Mortgage History
| Date | Status | Borrower | Loan Amount |
|---|---|---|---|
| Previous Owner | Parayo Penafrancia P | $70,000 | |
| Previous Owner | Parayo Edward | $61,800 | |
| Closed | Martin Antonio | $0 |
Source: Public Records
Tax History Compared to Growth
Tax History
| Year | Tax Paid | Tax Assessment Tax Assessment Total Assessment is a certain percentage of the fair market value that is determined by local assessors to be the total taxable value of land and additions on the property. | Land | Improvement |
|---|---|---|---|---|
| 2025 | $620 | $42,155 | $24,150 | $18,005 |
| 2024 | $602 | $42,155 | $24,150 | $18,005 |
| 2023 | $602 | $42,132 | $25,900 | $16,232 |
| 2022 | $585 | $36,320 | $21,700 | $14,620 |
| 2021 | $568 | $33,865 | $20,300 | $13,565 |
| 2020 | $568 | $32,449 | $19,250 | $13,199 |
| 2019 | $532 | $28,474 | $15,750 | $12,724 |
| 2018 | $508 | $24,569 | $12,600 | $11,969 |
| 2017 | $750 | $22,362 | $10,500 | $11,862 |
| 2016 | $477 | $18,499 | $7,000 | $11,499 |
| 2015 | $475 | $16,768 | $5,600 | $11,168 |
| 2014 | $460 | $14,492 | $4,200 | $10,292 |
Source: Public Records
Map
Nearby Homes
- 3600 Reynolds Ave
- 3601 E Webb Ave
- 1620 Kenneth St
- 1830 N Pecos Rd Unit 230
- 1830 N Pecos Rd Unit 137
- 3633 Karissa Heights Place
- 1766 Molly Meadows St
- 1891 Via Del Prado St
- 3701 Strutz Ave
- 1839 Vida Pacifica St
- 1606 Sugita Ln
- 3200 E Owens Ave
- 4924 Chidlaw Ave Unit 3
- 3662 Via Mariposa Ave
- 3205 Mary Ann Ave
- 1856 Vida Pacifica St
- 3795 E Pecan Ln
- 1947 Joyful St
- 3601 Thomas Ave
- 1720 Belmont St
- 3716 Reynolds Ave Unit Home
- 3712 Reynolds Ave
- 3717 Taylor Ave
- 3715 Taylor Ave
- 3708 Reynolds Ave
- 3717 Reynolds Ave
- 3709 Taylor Ave
- 3715 Reynolds Ave
- 3704 Reynolds Ave
- 3709 Reynolds Ave
- 3705 Taylor Ave
- 3705 Reynolds Ave
- 3700 Reynolds Ave
- 3716 Taylor Ave
- 3712 Stanley Ave
- 3701 Taylor Ave
- 3712 Taylor Ave
- 3701 Reynolds Ave
- 3708 Stanley Ave