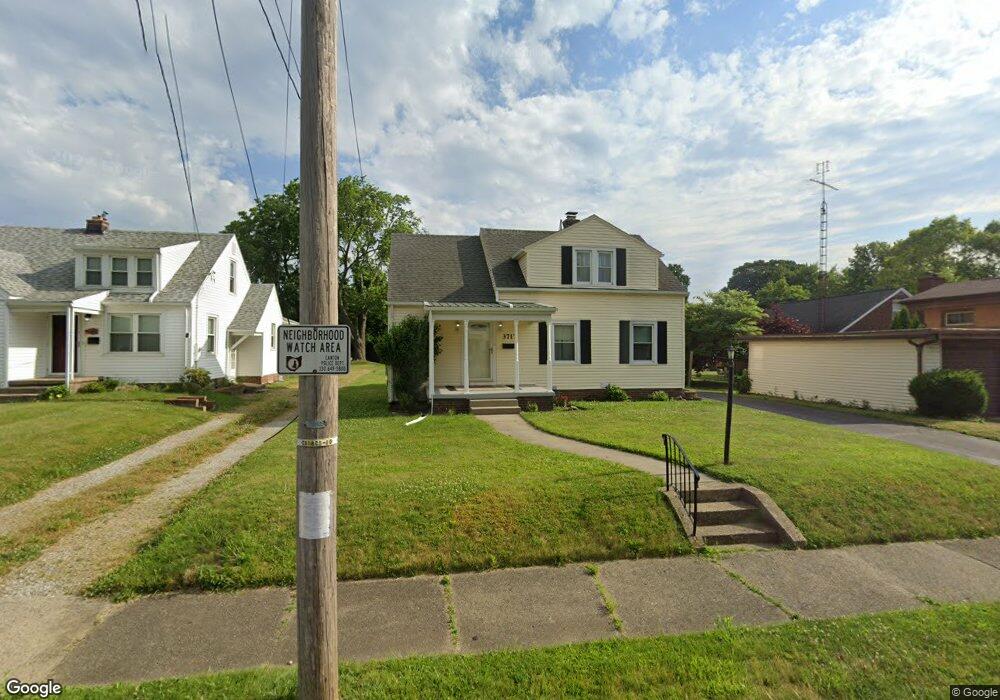
3717 12th St SW Canton, OH 44710
Estimated Value: $156,000 - $185,000
3
Beds
1
Bath
1,413
Sq Ft
$119/Sq Ft
Est. Value
About This Home
This home is located at 3717 12th St SW, Canton, OH 44710 and is currently estimated at $168,707, approximately $119 per square foot. 3717 12th St SW is a home located in Stark County with nearby schools including Harter Elementary School, Early Learning Center @ Schreiber, and Clarendon Intermediate School.
Ownership History
Date
Name
Owned For
Owner Type
Purchase Details
Closed on
Jun 15, 2017
Sold by
Barker Christy R and Lindesmith Christy R
Bought by
Strausbaugh Matthew and Strausbaugh Hannah M
Current Estimated Value
Home Financials for this Owner
Home Financials are based on the most recent Mortgage that was taken out on this home.
Original Mortgage
$92,635
Outstanding Balance
$77,053
Interest Rate
4.02%
Mortgage Type
Construction
Estimated Equity
$91,654
Purchase Details
Closed on
Sep 25, 1998
Sold by
Zufall Charles E
Bought by
Lindesmith Christy R
Home Financials for this Owner
Home Financials are based on the most recent Mortgage that was taken out on this home.
Original Mortgage
$66,900
Interest Rate
6.99%
Mortgage Type
New Conventional
Purchase Details
Closed on
Apr 21, 1993
Create a Home Valuation Report for This Property
The Home Valuation Report is an in-depth analysis detailing your home's value as well as a comparison with similar homes in the area
Home Values in the Area
Average Home Value in this Area
Purchase History
| Date | Buyer | Sale Price | Title Company |
|---|---|---|---|
| Strausbaugh Matthew | -- | None Available | |
| Lindesmith Christy R | $69,000 | -- | |
| -- | -- | -- |
Source: Public Records
Mortgage History
| Date | Status | Borrower | Loan Amount |
|---|---|---|---|
| Open | Strausbaugh Matthew | $92,635 | |
| Previous Owner | Lindesmith Christy R | $66,900 |
Source: Public Records
Tax History Compared to Growth
Tax History
| Year | Tax Paid | Tax Assessment Tax Assessment Total Assessment is a certain percentage of the fair market value that is determined by local assessors to be the total taxable value of land and additions on the property. | Land | Improvement |
|---|---|---|---|---|
| 2025 | -- | $45,920 | $10,360 | $35,560 |
| 2024 | -- | $45,920 | $10,360 | $35,560 |
| 2023 | $1,933 | $32,340 | $8,750 | $23,590 |
| 2022 | $939 | $32,340 | $8,750 | $23,590 |
| 2021 | $1,897 | $32,340 | $8,750 | $23,590 |
| 2020 | $1,716 | $26,180 | $7,210 | $18,970 |
| 2019 | $1,497 | $26,190 | $7,210 | $18,980 |
| 2018 | $1,506 | $26,190 | $7,210 | $18,980 |
| 2017 | $1,594 | $25,240 | $7,420 | $17,820 |
| 2016 | $1,598 | $25,210 | $7,420 | $17,790 |
| 2015 | $1,607 | $25,210 | $7,420 | $17,790 |
| 2014 | $1,637 | $24,130 | $7,110 | $17,020 |
| 2013 | $787 | $24,130 | $7,110 | $17,020 |
Source: Public Records
Map
Nearby Homes
- 3800 11th St SW
- 1226 Poplar Ave SW
- 1214 Roslyn Ave SW
- 1102 Rockwood Ave SW
- 1361 Crescent Rd SW
- 1013 Maryland Ave SW
- 1259 Hawthorne Ave SW
- 3204 14th St SW
- 1023 Wertz Ave SW
- 144 Aultman Ave NW
- 929 Wertz Ave SW
- 4418 7th St SW
- 123 Linwood Ave NW
- 3029 7th St SW
- 4522 7th St SW
- 218 Raff Rd NW
- 2711 Blair Place SW
- 1019 Dartmouth Ave SW
- 3006 6th St SW
- 1103 Manor Ave SW
- 3723 12th St SW
- 1149 Raff Rd SW
- 3727 12th St SW
- 1139 Raff Rd SW
- 1153 Raff Rd SW
- 1133 Raff Rd SW
- 3733 12th St SW
- 1140 Benskin Ave SW
- 1203 Raff Rd SW
- 1127 Raff Rd SW
- 1136 Benskin Ave SW
- 3737 12th St SW
- 3716 12th St SW
- 3722 12th St SW
- 1207 Raff Rd SW
- 1132 Benskin Ave SW
- 3726 12th St SW
- 1123 Raff Rd SW
- 3732 12th St SW
- 1211 Raff Rd SW