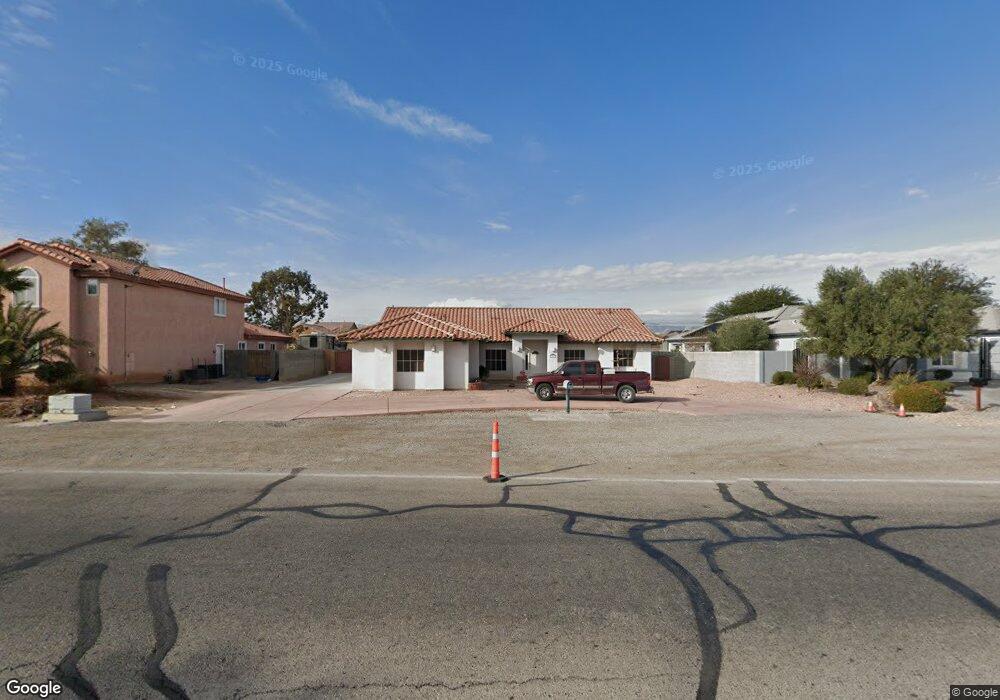
3717 Allen Ln North Las Vegas, NV 89032
Cheyenne NeighborhoodEstimated Value: $476,000 - $696,000
4
Beds
3
Baths
2,140
Sq Ft
$258/Sq Ft
Est. Value
About This Home
This home is located at 3717 Allen Ln, North Las Vegas, NV 89032 and is currently estimated at $553,079, approximately $258 per square foot. 3717 Allen Ln is a home located in Clark County with nearby schools including Lucile Bruner Elementary School, Theron L Swainston Middle School, and Cheyenne High School.
Ownership History
Date
Name
Owned For
Owner Type
Purchase Details
Closed on
Aug 14, 2008
Sold by
Friedland Robert E
Bought by
Barker Ronald and Barker Vicki
Current Estimated Value
Home Financials for this Owner
Home Financials are based on the most recent Mortgage that was taken out on this home.
Original Mortgage
$344,592
Outstanding Balance
$227,934
Interest Rate
6.49%
Mortgage Type
FHA
Estimated Equity
$325,145
Purchase Details
Closed on
Mar 25, 2008
Sold by
Mcclure Christopher and Mcclure Jennifer
Bought by
Friedland Robert E and The Robert E Friedland Living Trust
Purchase Details
Closed on
Mar 5, 2001
Sold by
Folk Jesse W and Folk Dora M
Bought by
Mcclure Christopher and Mcclure Jennifer
Home Financials for this Owner
Home Financials are based on the most recent Mortgage that was taken out on this home.
Original Mortgage
$135,000
Interest Rate
6.92%
Create a Home Valuation Report for This Property
The Home Valuation Report is an in-depth analysis detailing your home's value as well as a comparison with similar homes in the area
Home Values in the Area
Average Home Value in this Area
Purchase History
| Date | Buyer | Sale Price | Title Company |
|---|---|---|---|
| Barker Ronald | $350,000 | Nevada Title Las Vegas | |
| Friedland Robert E | $55,986 | Community Title | |
| Mcclure Christopher | $40,000 | First American Title Co |
Source: Public Records
Mortgage History
| Date | Status | Borrower | Loan Amount |
|---|---|---|---|
| Open | Barker Ronald | $344,592 | |
| Previous Owner | Mcclure Christopher | $135,000 | |
| Closed | Mcclure Christopher | $28,000 |
Source: Public Records
Tax History Compared to Growth
Tax History
| Year | Tax Paid | Tax Assessment Tax Assessment Total Assessment is a certain percentage of the fair market value that is determined by local assessors to be the total taxable value of land and additions on the property. | Land | Improvement |
|---|---|---|---|---|
| 2025 | $2,330 | $130,578 | $47,250 | $83,328 |
| 2024 | $2,263 | $130,578 | $47,250 | $83,328 |
| 2023 | $2,263 | $126,089 | $47,250 | $78,839 |
| 2022 | $2,197 | $115,715 | $43,750 | $71,965 |
| 2021 | $2,133 | $110,405 | $42,000 | $68,405 |
| 2020 | $2,068 | $101,859 | $34,125 | $67,734 |
| 2019 | $2,008 | $95,279 | $28,665 | $66,614 |
| 2018 | $1,949 | $84,049 | $20,020 | $64,029 |
| 2017 | $2,689 | $80,166 | $15,313 | $64,853 |
| 2016 | $1,846 | $74,603 | $8,750 | $65,853 |
| 2015 | $1,842 | $61,396 | $8,750 | $52,646 |
| 2014 | $1,788 | $53,977 | $8,750 | $45,227 |
Source: Public Records
Map
Nearby Homes
- 3809 Alpine Track Ave
- 3820 Alpine Track Ave
- 3937 Jamison Park Ln
- 3930 Burma Rd
- 3784 Nerine Pass Way
- 3524 Silver Lantern Dr
- 3629 Newton Falls St Unit 4
- 4076 Topaz Hills Dr
- 3505 Benson Ln
- 3614 Newton Falls St
- 3503 Oberon Ln
- 3538 Turchas Way
- 3910 Cheryl Clay Way
- 4013 W Delhi Ave
- 3556 Valley Lily St
- 3716 W Colton Ave
- 3548 Valley Lily St
- 3107 Atwater Dr
- 3924 W Colton Ave Unit 3
- 3606 Gold Sluice Ave
- 3725 Allen Ln
- 3709 Allen Ln
- 3714 Blake Canyon Dr
- 3714 Blake Canyon Dr
- 3718 Blake Canyon Dr
- 3710 Blake Canyon Dr
- 3737 Allen Ln
- 3643 Cool Vista Ct
- 3722 Blake Canyon Dr
- 3706 Blake Canyon Dr
- 3639 Cool Vista Ct
- 3639 Cool Vista Ct Unit n/a
- 3647 Cool Vista Ct
- 3726 Blake Canyon Dr
- 3702 Blake Canyon Dr
- 0 Squaw Ridge Unit 2548901
- 3741 Allen Ln
- 3713 Seneca Highland St
- 3717 Seneca Highland St
- 3709 Seneca Highland St