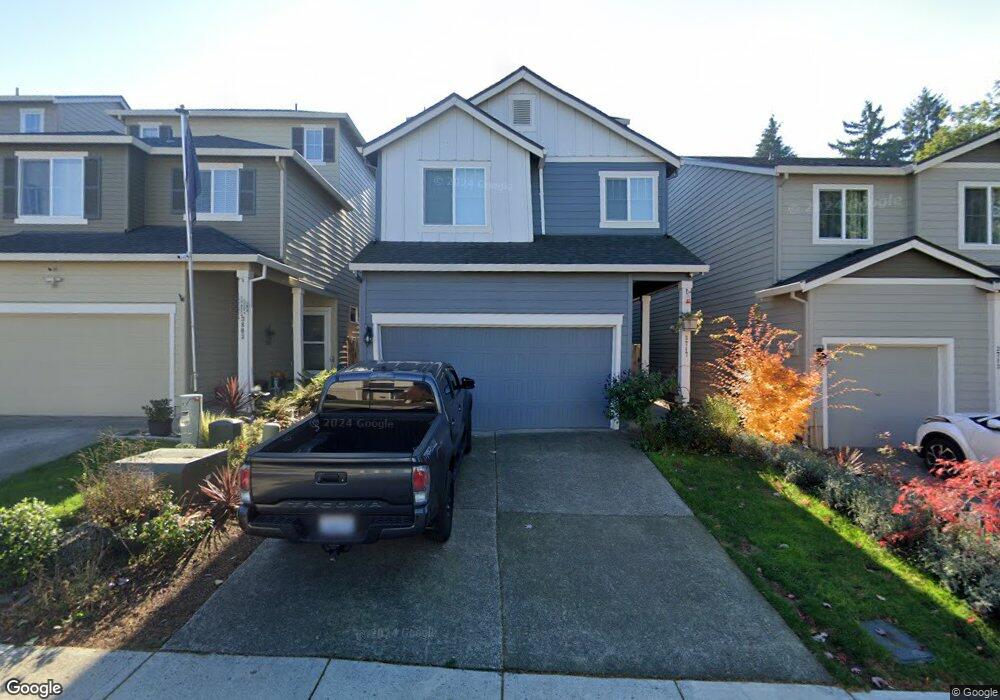
3717 NE 62nd St Vancouver, WA 98661
Minnehaha NeighborhoodEstimated Value: $430,000 - $574,000
3
Beds
3
Baths
2,064
Sq Ft
$243/Sq Ft
Est. Value
About This Home
This home is located at 3717 NE 62nd St, Vancouver, WA 98661 and is currently estimated at $500,810, approximately $242 per square foot. 3717 NE 62nd St is a home with nearby schools including Minnehaha Elementary School, Jason Lee Middle School, and Hudson's Bay High School.
Ownership History
Date
Name
Owned For
Owner Type
Purchase Details
Closed on
Jul 15, 2021
Sold by
Bentinck William C and Bentinck Heather S
Bought by
Kupfer Joseph and Kupfer Kaila
Current Estimated Value
Home Financials for this Owner
Home Financials are based on the most recent Mortgage that was taken out on this home.
Original Mortgage
$284,000
Outstanding Balance
$257,804
Interest Rate
2.93%
Mortgage Type
New Conventional
Estimated Equity
$243,006
Purchase Details
Closed on
May 24, 2018
Sold by
Bentinck William C and Bentinck Heather S
Bought by
Bentinck William C and Bentinck Heather S
Purchase Details
Closed on
Mar 3, 2018
Sold by
Dr Horotn Inc Protlan D
Bought by
Bentinck William C and Bentinck Heather S
Home Financials for this Owner
Home Financials are based on the most recent Mortgage that was taken out on this home.
Original Mortgage
$236,245
Interest Rate
4.22%
Mortgage Type
New Conventional
Purchase Details
Closed on
May 15, 2017
Sold by
Boespflug Development Inc
Bought by
R Horton Inc-Portland D
Create a Home Valuation Report for This Property
The Home Valuation Report is an in-depth analysis detailing your home's value as well as a comparison with similar homes in the area
Home Values in the Area
Average Home Value in this Area
Purchase History
| Date | Buyer | Sale Price | Title Company |
|---|---|---|---|
| Kupfer Joseph | $355,000 | Chicago Title Company Of Wa | |
| Bentinck William C | -- | None Available | |
| Bentinck William C | $314,996 | First American Title Ins Co | |
| R Horton Inc-Portland D | $1,987,800 | Chicago Title Dt Vancouver |
Source: Public Records
Mortgage History
| Date | Status | Borrower | Loan Amount |
|---|---|---|---|
| Open | Kupfer Joseph | $284,000 | |
| Previous Owner | Bentinck William C | $236,245 |
Source: Public Records
Tax History Compared to Growth
Tax History
| Year | Tax Paid | Tax Assessment Tax Assessment Total Assessment is a certain percentage of the fair market value that is determined by local assessors to be the total taxable value of land and additions on the property. | Land | Improvement |
|---|---|---|---|---|
| 2025 | $4,630 | $480,418 | $134,400 | $346,018 |
| 2024 | $4,637 | $455,668 | $134,400 | $321,268 |
| 2023 | $4,510 | $482,404 | $140,400 | $342,004 |
| 2022 | $4,225 | $469,014 | $140,400 | $328,614 |
| 2021 | $4,118 | $401,385 | $120,000 | $281,385 |
| 2020 | $3,691 | $367,030 | $113,750 | $253,280 |
| 2019 | $3,240 | $337,607 | $89,505 | $248,102 |
| 2018 | $932 | $306,823 | $0 | $0 |
| 2017 | $0 | $65,000 | $0 | $0 |
Source: Public Records
Map
Nearby Homes
- 3504 NE 59th St
- 3901 NE 57th St
- 4306 NE 61st St
- 5701 NE St Johns Rd Unit 86
- 5701 NE St Johns Rd Unit 4
- 5701 NE St Johns Rd Unit 36
- 5701 NE St Johns Rd Unit 60
- 5701 NE St Johns Rd Unit 24
- 6015 NE 44th Ave
- 3602 NE 54th St
- 3001 NE 59th St
- 6107 NE 45th Ct
- 4910 NE 40th Ave
- 2716 NE 53rd St
- 2507 NE 59th St
- 3609 NE 49th St
- 2612 NE 53rd St
- 2608 NE 53rd St
- 5102 NE 28th Ave
- 2510 NE 54th St
- 3713 NE 62nd St
- 3803 NE 62nd St
- 3716 NE 60th St
- 3807 NE 62nd St
- 3800 NE 61st St
- 3714 NE 61st St
- 3811 NE 62nd St
- 3710 NE 61st St
- 3804 NE 61st St
- 3808 NE 61st St
- 3716 NE 62nd St
- 3802 NE 62nd St
- 3806 NE 62nd St
- 3814 NE 62nd St
- 3810 NE 62nd St
- 3701 NE Minnehaha St
- 3706 NE 60th St
- 6109 NE 38th Place
- 6113 NE 38th Place
- 3711 NE 61st St