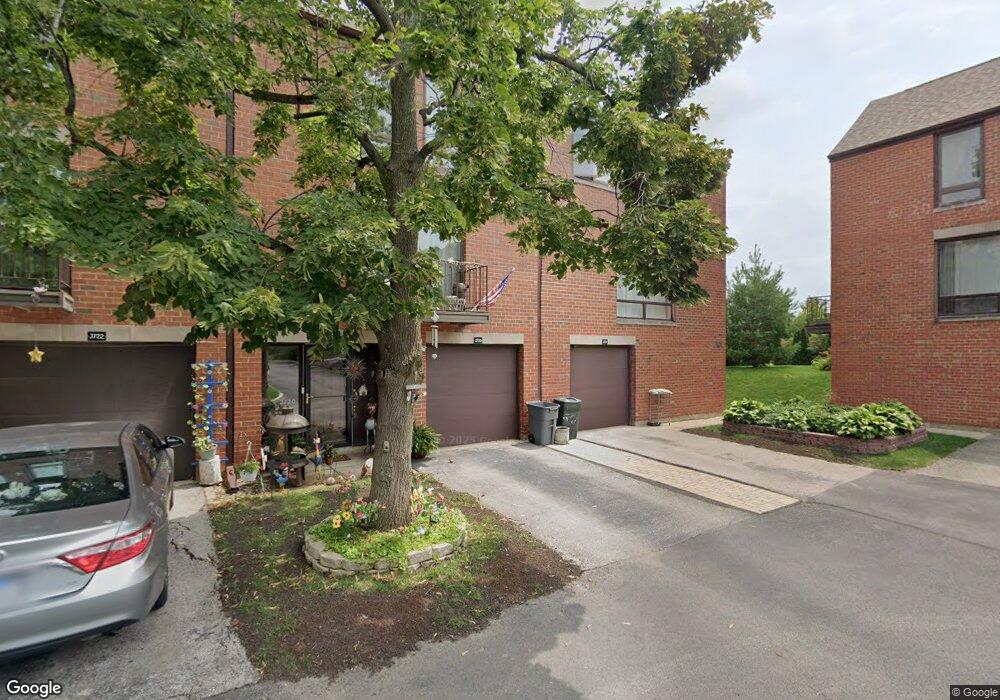
3718 Capri Ct Unit T19D Glenview, IL 60025
Estimated Value: $350,751 - $443,000
3
Beds
--
Bath
2,185
Sq Ft
$189/Sq Ft
Est. Value
About This Home
This home is located at 3718 Capri Ct Unit T19D, Glenview, IL 60025 and is currently estimated at $413,188, approximately $189 per square foot. 3718 Capri Ct Unit T19D is a home located in Cook County with nearby schools including Henking Elementary School, Hoffman Elementary School, and Springman Middle School.
Ownership History
Date
Name
Owned For
Owner Type
Purchase Details
Closed on
Jul 9, 2021
Sold by
Salganik Alexander and Kashper Yelena
Bought by
Salganik Alexander and Salganik Samuale
Current Estimated Value
Home Financials for this Owner
Home Financials are based on the most recent Mortgage that was taken out on this home.
Original Mortgage
$178,300
Interest Rate
3.25%
Mortgage Type
New Conventional
Purchase Details
Closed on
Mar 28, 1998
Sold by
Kashper Yelena
Bought by
Salganik Alexander and Kashper Yelena
Home Financials for this Owner
Home Financials are based on the most recent Mortgage that was taken out on this home.
Original Mortgage
$117,500
Interest Rate
7.26%
Purchase Details
Closed on
Jan 3, 1995
Sold by
Kashper Victor
Bought by
Kashper Yelena
Create a Home Valuation Report for This Property
The Home Valuation Report is an in-depth analysis detailing your home's value as well as a comparison with similar homes in the area
Home Values in the Area
Average Home Value in this Area
Purchase History
| Date | Buyer | Sale Price | Title Company |
|---|---|---|---|
| Salganik Alexander | -- | Citywide Title Corporation | |
| Salganik Alexander | -- | Chicago Title Insurance Co | |
| Kashper Yelena | -- | -- |
Source: Public Records
Mortgage History
| Date | Status | Borrower | Loan Amount |
|---|---|---|---|
| Closed | Salganik Alexander | $178,300 | |
| Closed | Salganik Alexander | $117,500 |
Source: Public Records
Tax History
| Year | Tax Paid | Tax Assessment Tax Assessment Total Assessment is a certain percentage of the fair market value that is determined by local assessors to be the total taxable value of land and additions on the property. | Land | Improvement |
|---|---|---|---|---|
| 2025 | $6,007 | $39,953 | $1,650 | $38,303 |
| 2024 | $6,007 | $28,840 | $1,396 | $27,444 |
| 2023 | $5,642 | $28,840 | $1,396 | $27,444 |
| 2022 | $5,642 | $28,840 | $1,396 | $27,444 |
| 2021 | $6,559 | $28,685 | $952 | $27,733 |
| 2020 | $6,576 | $28,685 | $952 | $27,733 |
| 2019 | $5,678 | $29,573 | $952 | $28,621 |
| 2018 | $4,536 | $22,135 | $761 | $21,374 |
| 2017 | $4,424 | $22,135 | $761 | $21,374 |
| 2016 | $4,364 | $22,135 | $761 | $21,374 |
| 2015 | $4,497 | $20,711 | $666 | $20,045 |
| 2014 | $4,413 | $20,711 | $666 | $20,045 |
| 2013 | $4,274 | $20,711 | $666 | $20,045 |
Source: Public Records
Map
Nearby Homes
- 3732 Capri Ct Unit T18A
- 3801 Appian Way Unit 403
- 3700 Capri Ct Unit 510
- 701 Forum Square Unit 102
- 10385 Dearlove Rd Unit 1I
- 3724 Liberty Ln
- 3505 Linneman St
- 606 Greendale Rd
- 4188 Cove Ln Unit F
- 524 Hazelwood Ln
- 329 Cherry Ct
- 1028 Highland Ln
- 9517 W Central Rd
- 3843 Springdale Ave
- 602 Glenshire Rd
- 1026 Castilian Ct Unit D162
- 525 Glenshire Rd
- 1002 Castilian Ct Unit B302
- 9078 W Heathwood Dr Unit 1M
- 8936 Northshore Dr Unit 104D
- 3720 Capri Ct Unit T19C
- 3722 Capri Ct Unit T19B
- 3716 Capri Ct Unit T20A
- 3714 Capri Ct Unit T20B
- 3712 Capri Ct Unit T20C
- 3726 Capri Ct Unit T18D
- 3710 Capri Ct Unit T20D
- 3724 Capri Ct Unit T19A
- 3730 Capri Ct Unit T18B
- 3728 Capri Ct Unit T18C
- 3708 Capri Ct Unit T21A
- 3706 Capri Ct Unit T21B
- 3704 Capri Ct Unit T21C
- 3702 Capri Ct Unit T21D
- 3827 Linneman St
- 3821 Linneman St
- 3833 Linneman St
- 3833 Linneman St
- 615 Milwaukee Ave
- 3801 Appian Way Unit 104
Your Personal Tour Guide
Ask me questions while you tour the home.