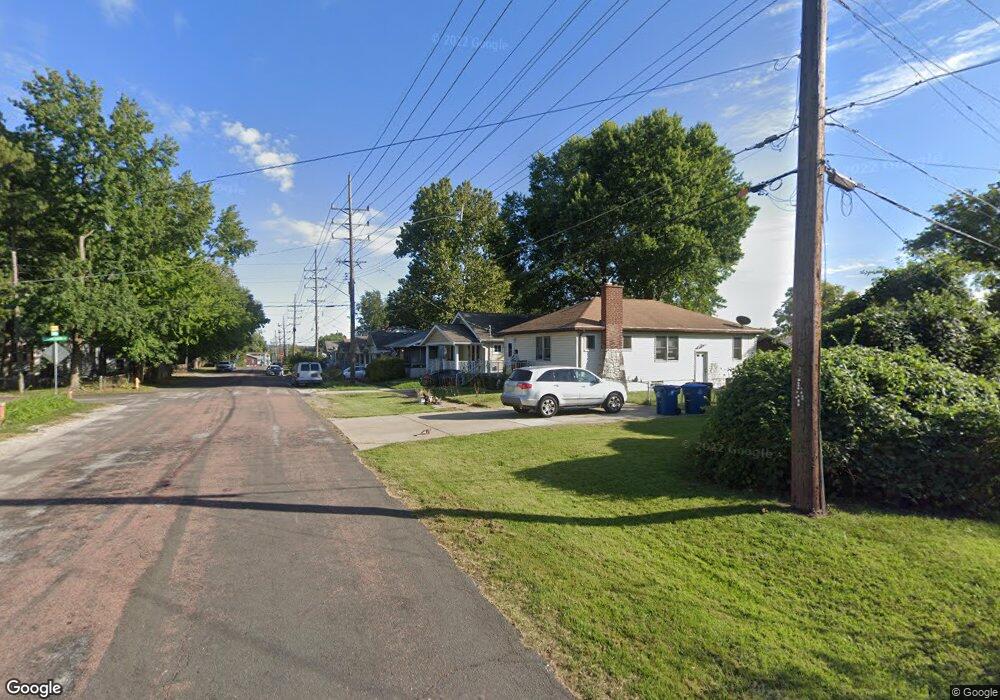
3718 Fannie Ave Saint Louis, MO 63125
Lemay NeighborhoodEstimated Value: $131,000 - $181,000
2
Beds
2
Baths
936
Sq Ft
$166/Sq Ft
Est. Value
About This Home
This home is located at 3718 Fannie Ave, Saint Louis, MO 63125 and is currently estimated at $155,359, approximately $165 per square foot. 3718 Fannie Ave is a home located in St. Louis County with nearby schools including Hancock Place Elementary School, Hancock Place Middle School, and Hancock Place High School.
Ownership History
Date
Name
Owned For
Owner Type
Purchase Details
Closed on
Sep 21, 2024
Sold by
Mcmanus Jeffrey and Mcmanus Allison
Bought by
Birdie Angela J
Current Estimated Value
Purchase Details
Closed on
Jun 2, 2009
Sold by
Mcmanus Robert
Bought by
Mcmanus Jeffrey Robert
Purchase Details
Closed on
Aug 11, 2008
Sold by
Baranowski Charles and Baranowski Ruth A
Bought by
Mcmanus Robert
Purchase Details
Closed on
Jul 12, 2004
Sold by
Thompson Goldie L
Bought by
Crecelius Barbara J and Baranowski Ruth A
Create a Home Valuation Report for This Property
The Home Valuation Report is an in-depth analysis detailing your home's value as well as a comparison with similar homes in the area
Home Values in the Area
Average Home Value in this Area
Purchase History
| Date | Buyer | Sale Price | Title Company |
|---|---|---|---|
| Birdie Angela J | -- | None Listed On Document | |
| Mcmanus Jeffrey Robert | -- | None Available | |
| Mcmanus Robert | $50,000 | Ctc | |
| Crecelius Barbara J | -- | -- |
Source: Public Records
Tax History Compared to Growth
Tax History
| Year | Tax Paid | Tax Assessment Tax Assessment Total Assessment is a certain percentage of the fair market value that is determined by local assessors to be the total taxable value of land and additions on the property. | Land | Improvement |
|---|---|---|---|---|
| 2025 | $2,098 | $32,570 | $11,400 | $21,170 |
| 2024 | $2,098 | $27,060 | $4,560 | $22,500 |
| 2023 | $1,993 | $27,060 | $4,560 | $22,500 |
| 2022 | $1,831 | $22,510 | $5,260 | $17,250 |
| 2021 | $1,799 | $22,510 | $5,260 | $17,250 |
| 2020 | $1,520 | $18,120 | $5,260 | $12,860 |
| 2019 | $1,516 | $18,120 | $5,260 | $12,860 |
| 2018 | $1,357 | $14,120 | $4,030 | $10,090 |
| 2017 | $1,334 | $14,120 | $4,030 | $10,090 |
| 2016 | $1,140 | $11,590 | $1,750 | $9,840 |
| 2015 | $1,134 | $11,590 | $1,750 | $9,840 |
| 2014 | $1,007 | $10,910 | $3,310 | $7,600 |
Source: Public Records
Map
Nearby Homes
- 514 E Dallas Ct
- 622 Kayser Ave
- 712 Pardella Ave
- 8626 Shoss Ave
- 610 Kayser Ave
- 252 Wachtel Ave
- 711 Erskine Ave
- 241 Dammert Ave
- 715 Erskine Ave
- 765 Pardella Ave Unit A
- 8439 Tennessee Ave
- 235 Military Rd
- 720 Erskine Ave
- 8523 Idaho Ave
- 300 Kayser Ave
- 302 Waller Ave
- 335 Horn Ave
- 3708 Comstock Dr
- 3720 Comstock Dr
- 522 Lagro Ave
- 3716 Fannie Ave
- 3720 Fannie Ave
- 3714 Fannie Ave
- 3712 Fannie Ave
- 3717 Risch Ave
- 3719 Risch Ave
- 3715 Risch Ave
- 3710 Fannie Ave
- 3713 Risch Ave
- 300 Landor Ct
- 264 Baumann Ave
- 304 Landor Ct
- 3801 Fannie Ave
- 3708 Fannie Ave
- 3711 Risch Ave
- 308 Landor Ct
- 3706 Fannie Ave
- 250 Baumann Ave
- 3709 Risch Ave
- 261 Baumann Ave