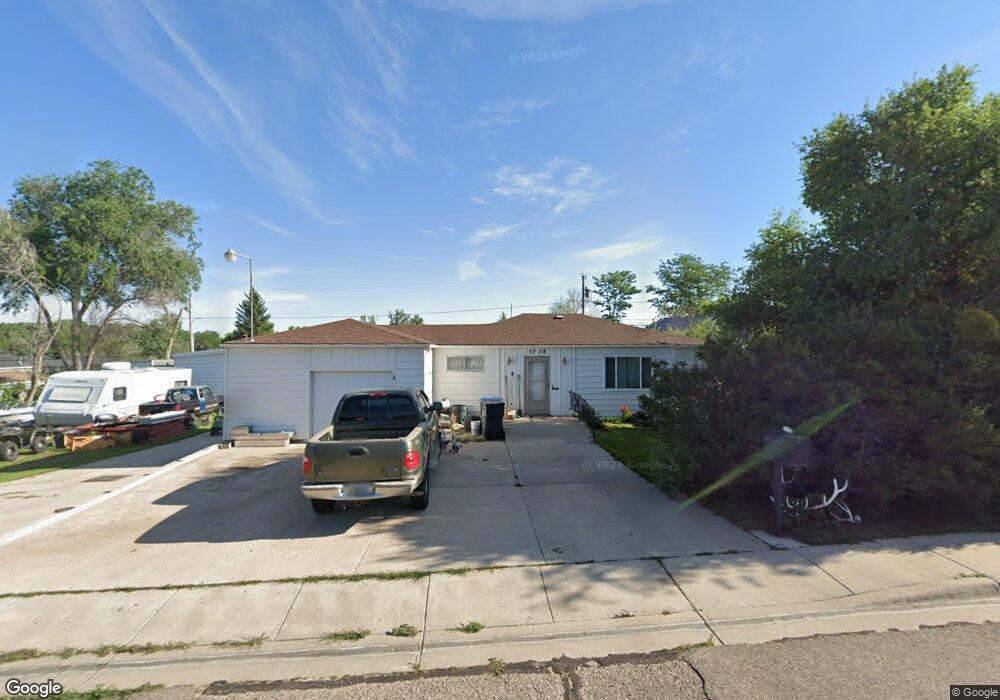
3718 Laramie St Cheyenne, WY 82001
Estimated Value: $301,000 - $364,000
--
Bed
1
Bath
1,172
Sq Ft
$290/Sq Ft
Est. Value
About This Home
This home is located at 3718 Laramie St, Cheyenne, WY 82001 and is currently estimated at $340,375, approximately $290 per square foot. 3718 Laramie St is a home located in Laramie County with nearby schools including Baggs Elementary School, Carey Junior High School, and East High School.
Ownership History
Date
Name
Owned For
Owner Type
Purchase Details
Closed on
Jul 30, 2018
Sold by
Varland Shawn M
Bought by
Varland Shawn M and Varland Rebecca S
Current Estimated Value
Home Financials for this Owner
Home Financials are based on the most recent Mortgage that was taken out on this home.
Original Mortgage
$208,209
Outstanding Balance
$127,098
Interest Rate
4.5%
Mortgage Type
Purchase Money Mortgage
Estimated Equity
$213,277
Purchase Details
Closed on
Oct 30, 2015
Sold by
Ultra Plumbing And Heating Llc
Bought by
Padilla Max and Padilla Charlene
Purchase Details
Closed on
Aug 17, 2011
Sold by
Varland Patrick L and Varland Steven A
Bought by
Varland Shawn M
Home Financials for this Owner
Home Financials are based on the most recent Mortgage that was taken out on this home.
Original Mortgage
$136,451
Interest Rate
4.75%
Mortgage Type
FHA
Create a Home Valuation Report for This Property
The Home Valuation Report is an in-depth analysis detailing your home's value as well as a comparison with similar homes in the area
Home Values in the Area
Average Home Value in this Area
Purchase History
| Date | Buyer | Sale Price | Title Company |
|---|---|---|---|
| Varland Shawn M | -- | None Available | |
| Padilla Max | -- | First American Title | |
| Varland Shawn M | -- | None Available |
Source: Public Records
Mortgage History
| Date | Status | Borrower | Loan Amount |
|---|---|---|---|
| Open | Varland Shawn M | $208,209 | |
| Previous Owner | Varland Shawn M | $136,451 |
Source: Public Records
Tax History Compared to Growth
Tax History
| Year | Tax Paid | Tax Assessment Tax Assessment Total Assessment is a certain percentage of the fair market value that is determined by local assessors to be the total taxable value of land and additions on the property. | Land | Improvement |
|---|---|---|---|---|
| 2025 | $2,053 | $22,323 | $2,675 | $19,648 |
| 2024 | $2,053 | $29,037 | $3,567 | $25,470 |
| 2023 | $1,984 | $28,058 | $3,567 | $24,491 |
| 2022 | $1,737 | $24,059 | $3,567 | $20,492 |
| 2021 | $1,615 | $22,326 | $3,236 | $19,090 |
| 2020 | $1,432 | $19,848 | $3,236 | $16,612 |
| 2019 | $1,314 | $18,195 | $3,236 | $14,959 |
| 2018 | $1,244 | $17,399 | $3,236 | $14,163 |
| 2017 | $1,166 | $16,161 | $3,236 | $12,925 |
| 2016 | $1,074 | $14,879 | $3,048 | $11,831 |
| 2015 | $1,055 | $14,602 | $3,048 | $11,554 |
| 2014 | $1,085 | $14,922 | $3,048 | $11,874 |
Source: Public Records
Map
Nearby Homes
- 3711 Rawlins St
- 3802 Mccann Ave
- TBD Rock Springs St
- 4002 Cheyenne St
- 3316 Rock Springs St
- Lot 1 Block 2 N College Dr
- Lot 1 Block 1 N College Dr
- 3820 E Pershing Blvd
- 3820 E Pershing Blvd
- 4315 Bevans St
- Proposed Lot 3 Ridge Rd
- Proposed Lot 2 Ridge Rd
- Proposed Lot 4 Ridge Rd
- 3207 Cheyenne St
- 3315 Grove Dr
- TBD Atkin St
- 2334 Mccann Ave Unit 56
- 4547 Rock Springs St
- 4112 Gem Trail
- 4519 Marble Ave
- 3708 Laramie St
- 3728 Laramie St
- 3711 Bevans St
- 3717 Bevans St
- 3702 Laramie St
- 3723 Bevans St
- 3715 Laramie St
- 3540 Mccann Ave
- 3703 Bevans St
- 3703 Bevans St Unit TR 8
- 3617 Laramie St
- 3615 Laramie St
- 3802 Laramie St
- 3621 Laramie St
- 3617 Bevans St
- 3532 Mccann Ave
- 3619 Bevans St
- 3803 Bevans St
- 3609 Laramie St
- 3609 Laramie St