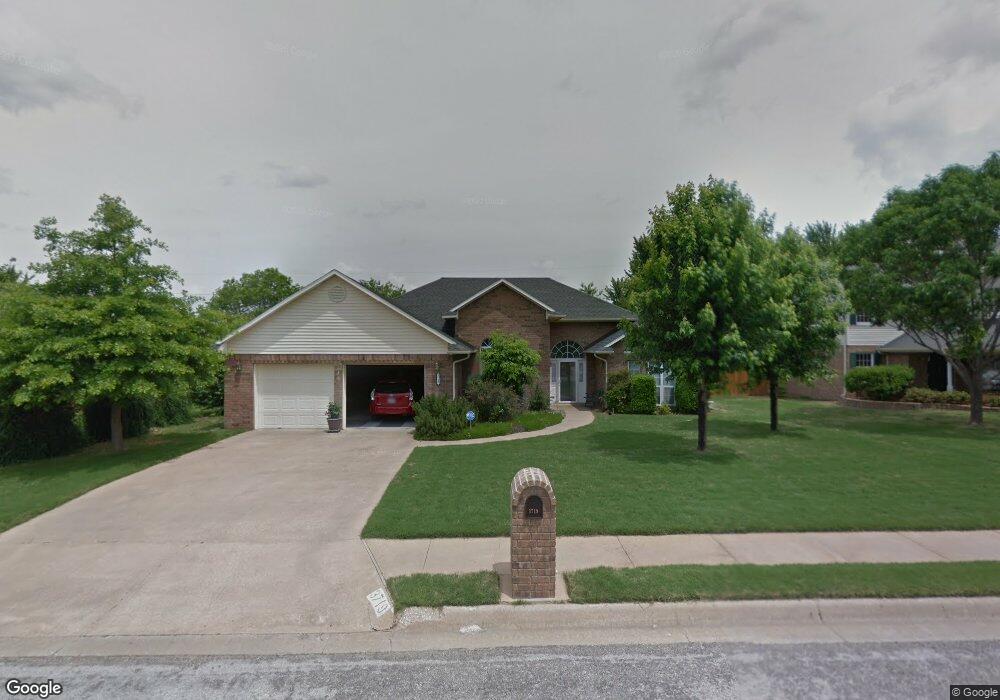
3719 W Easy St Rogers, AR 72756
Estimated Value: $395,530 - $497,000
--
Bed
2
Baths
2,133
Sq Ft
$203/Sq Ft
Est. Value
About This Home
This home is located at 3719 W Easy St, Rogers, AR 72756 and is currently estimated at $433,133, approximately $203 per square foot. 3719 W Easy St is a home located in Benton County with nearby schools including Reagan Elementary School, Oakdale Middle School, and Rogers Heritage High School.
Ownership History
Date
Name
Owned For
Owner Type
Purchase Details
Closed on
Sep 12, 2014
Sold by
Slone John and Slone Carol
Bought by
Jungers Nicholas J and Jungers Cheryl A
Current Estimated Value
Purchase Details
Closed on
Jun 24, 2005
Sold by
Davis Richard Dean and Davis Vivian Elaine
Bought by
Jungers Nicholas J and Jungers Cheryl A
Purchase Details
Closed on
Aug 31, 2004
Bought by
Jungers
Purchase Details
Closed on
Aug 24, 2004
Bought by
Jungers
Purchase Details
Closed on
Mar 13, 2002
Bought by
Glinski
Purchase Details
Closed on
Mar 7, 2002
Bought by
Turner Family Trust
Purchase Details
Closed on
Mar 4, 2002
Bought by
Turner Family Trust
Purchase Details
Closed on
May 30, 2000
Bought by
Turner Tr
Purchase Details
Closed on
Apr 18, 1999
Bought by
Dod 04-18-1999
Purchase Details
Closed on
Oct 26, 1995
Bought by
Turner Family Trust
Purchase Details
Closed on
Sep 16, 1993
Bought by
Swanda
Purchase Details
Closed on
Mar 24, 1993
Bought by
Swanda Const
Create a Home Valuation Report for This Property
The Home Valuation Report is an in-depth analysis detailing your home's value as well as a comparison with similar homes in the area
Home Values in the Area
Average Home Value in this Area
Purchase History
| Date | Buyer | Sale Price | Title Company |
|---|---|---|---|
| Jungers Nicholas J | $1,000 | None Available | |
| Jungers Nicholas J | $125,000 | None Available | |
| Jungers | $187,000 | -- | |
| Jungers | $187,000 | -- | |
| Glinski | $162,000 | -- | |
| Turner Family Trust | -- | -- | |
| Turner Family Trust | -- | -- | |
| Turner Tr | $152,000 | -- | |
| Dod 04-18-1999 | -- | -- | |
| Turner Family Trust | -- | -- | |
| Swanda | -- | -- | |
| Swanda Const | $18,000 | -- |
Source: Public Records
Tax History Compared to Growth
Tax History
| Year | Tax Paid | Tax Assessment Tax Assessment Total Assessment is a certain percentage of the fair market value that is determined by local assessors to be the total taxable value of land and additions on the property. | Land | Improvement |
|---|---|---|---|---|
| 2025 | $1,897 | $72,777 | $19,000 | $53,777 |
| 2024 | $1,850 | $72,777 | $19,000 | $53,777 |
| 2023 | $1,850 | $48,340 | $9,000 | $39,340 |
| 2022 | $1,549 | $48,340 | $9,000 | $39,340 |
| 2021 | $1,544 | $48,340 | $9,000 | $39,340 |
| 2020 | $1,545 | $36,220 | $5,400 | $30,820 |
| 2019 | $1,545 | $36,220 | $5,400 | $30,820 |
| 2018 | $1,570 | $36,220 | $5,400 | $30,820 |
| 2017 | $1,465 | $36,220 | $5,400 | $30,820 |
| 2016 | $1,465 | $36,220 | $5,400 | $30,820 |
| 2015 | $1,836 | $34,700 | $5,200 | $29,500 |
| 2014 | $1,486 | $34,700 | $5,200 | $29,500 |
Source: Public Records
Map
Nearby Homes
- 1205 N Mallard Ln
- 3907 W Easy St
- 3607 W Bishop Dr
- Lots 44-47 N Cardinal Dr
- 1204 N 36th St
- 1105 N Cardinal Dr
- 3.78 AC N 35th St
- 910 N 37th St
- 1209 N 31st St
- 3402 W Center St
- 4126 (MODEL UNIT) W Olive St
- 3506 W Olive St
- 2803 W Bishop Dr
- 505 N 37th St
- 812 N 28th St
- 2913 Richwood Cir
- 3807 W Cedar St
- 3604 W Beechwood Dr
- 3801 W Cedar St
- 3403 W Beechwood Dr Unit duplex
- 3717 W Easy St
- 3721 W Easy St
- 3715 W Easy St
- 3723 W Easy St
- 3718 W Easy St
- 1307 N Quail Terrace
- 1306 N Mallard Ln
- 3713 W Easy St
- 3725 W Easy St
- 1305 N Quail Terrace
- 1306 N Quail Terrace
- 1304 N Mallard Ln
- 3711 W Easy St
- 1304 N Quail Terrace
- 3801 W Easy St
- 1303 N Quail Terrace
- 1307 N Mallard Ln
- 1302 N Mallard Ln
- 1307 N Flamingo Rd
- 1302 N Quail Terrace