372 Abernathy Cir SE Palm Bay, FL 32909
Bayside Lakes NeighborhoodEstimated Value: $372,000 - $454,000
4
Beds
3
Baths
2,357
Sq Ft
$174/Sq Ft
Est. Value
About This Home
This home is located at 372 Abernathy Cir SE, Palm Bay, FL 32909 and is currently estimated at $410,466, approximately $174 per square foot. 372 Abernathy Cir SE is a home with nearby schools including Westside Elementary School, Southwest Middle School, and Bayside High School.
Ownership History
Date
Name
Owned For
Owner Type
Purchase Details
Closed on
Jun 11, 2018
Sold by
Fanelli Frank
Bought by
Fanelli Frank and Fanelli Janice
Current Estimated Value
Home Financials for this Owner
Home Financials are based on the most recent Mortgage that was taken out on this home.
Original Mortgage
$266,514
Outstanding Balance
$231,006
Interest Rate
4.6%
Estimated Equity
$179,460
Purchase Details
Closed on
Nov 14, 2016
Sold by
Fanelli Frank
Bought by
Fanelli Frank and Etten Virginia Vann
Purchase Details
Closed on
Jun 20, 2016
Sold by
Fanelli Frank and Fanelli Janice
Bought by
Fanelli Frank and Fanelli Van Etten
Purchase Details
Closed on
Apr 18, 2013
Sold by
D R Horton Inc
Bought by
Fanelli Frank
Home Financials for this Owner
Home Financials are based on the most recent Mortgage that was taken out on this home.
Original Mortgage
$204,300
Interest Rate
3.59%
Purchase Details
Closed on
May 11, 2010
Sold by
Singer Tracy L and Coventry Of Cocoa Homeowners A
Bought by
Citimortgage Inc
Create a Home Valuation Report for This Property
The Home Valuation Report is an in-depth analysis detailing your home's value as well as a comparison with similar homes in the area
Home Values in the Area
Average Home Value in this Area
Purchase History
| Date | Buyer | Sale Price | Title Company |
|---|---|---|---|
| Fanelli Frank | $91,484 | Attorney | |
| Fanelli Frank | -- | Attorney | |
| Fanelli Frank | -- | None Available | |
| Fanelli Frank | $200,000 | Dhi Title Of Florida Inc | |
| Citimortgage Inc | -- | Attorney |
Source: Public Records
Mortgage History
| Date | Status | Borrower | Loan Amount |
|---|---|---|---|
| Open | Fanelli Frank | $266,514 | |
| Previous Owner | Fanelli Frank | $204,300 |
Source: Public Records
Tax History Compared to Growth
Tax History
| Year | Tax Paid | Tax Assessment Tax Assessment Total Assessment is a certain percentage of the fair market value that is determined by local assessors to be the total taxable value of land and additions on the property. | Land | Improvement |
|---|---|---|---|---|
| 2025 | $2,793 | $194,870 | -- | -- |
| 2024 | $2,726 | $189,380 | -- | -- |
| 2023 | $2,726 | $183,870 | $0 | $0 |
| 2022 | $2,623 | $178,520 | $0 | $0 |
| 2021 | $2,683 | $173,330 | $0 | $0 |
| 2020 | $2,629 | $170,940 | $0 | $0 |
| 2019 | $2,790 | $167,100 | $0 | $0 |
| 2018 | $2,722 | $163,990 | $0 | $0 |
| 2017 | $2,741 | $160,620 | $0 | $0 |
| 2016 | $2,574 | $157,320 | $25,000 | $132,320 |
| 2015 | $2,625 | $156,230 | $25,000 | $131,230 |
| 2014 | $2,639 | $154,990 | $15,000 | $139,990 |
Source: Public Records
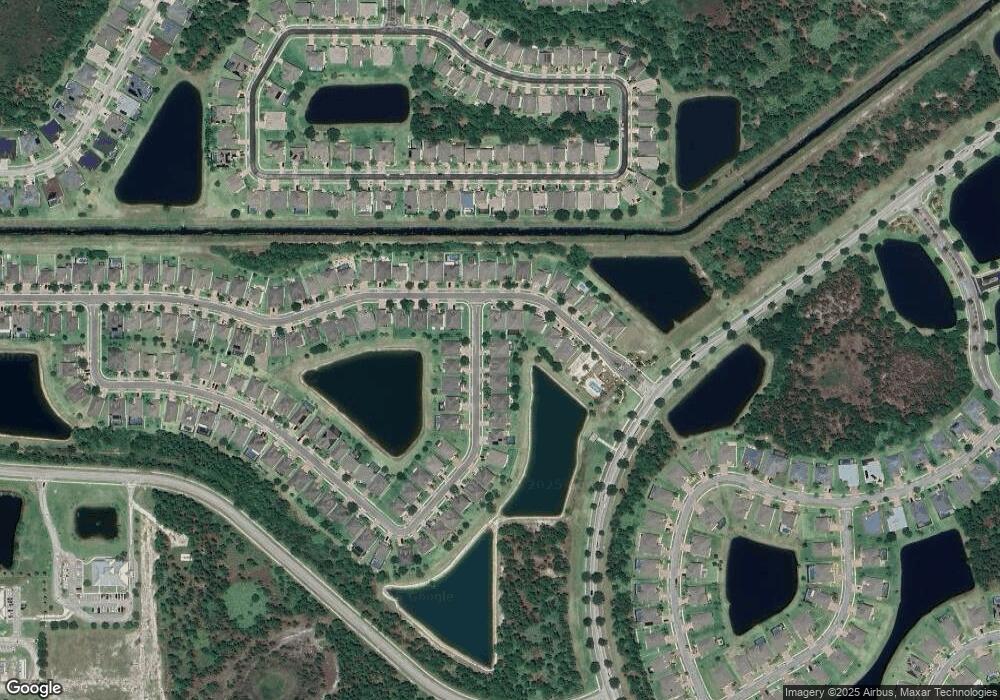
Map
Nearby Homes
- 297 Breckenridge Cir SE
- 439 Gardendale Cir SE
- 580 Easton Forest Cir SE
- 569 Dillard Dr SE
- 680 Easton Forest Cir SE
- 611 Easton Forest Cir SE
- 2051 Thornwood Dr SE
- 560 Remington Green Dr SE Unit 103
- 278 Brandy Creek Cir SE
- 721 Dillard Dr SE
- 643 Rangewood Dr SE
- 115 Ridgemont Cir SE
- 620 Remington Green Dr SE Unit 105
- 590 Remington Green Dr SE Unit 104
- 665 Remington Green Dr SE
- 151 Dailey St SE
- 171 Dailey St SE
- 980 Dillard Dr SE
- 1071 Dillard Dr SE
- 256 Feldman St SE
- 340 Broyles Dr SE
- 352 Broyles Dr SE
- 360 Abernathy Cir SE
- 364 Broyles Dr
- 373 Abernathy Cir SE
- 376 Broyles Dr SE
- 367 Abernathy Cir SE
- 354 Abernathy Cir SE
- 328 Broyles Dr SE
- 359 Broyles Dr SE
- 361 Abernathy Cir SE
- 382 Broyles Dr SE
- 322 Broyles Dr SE
- 348 Abernathy Cir SE
- 353 Broyles Dr Unit GOLFCS
- 355 Abernathy Cir SE
- 347 Broyles Dr SE Unit GOLFCS
- 347 Broyles Dr SE
- 341 Broyles Dr SE Unit GOLFCS
- 341 Broyles Dr SE